
What is HoloInsight
HoloInsight is a cloud-native observability platform with a special focus on real-time log analysis and AI integration. You can check the following documentation for more information.
HoloInsight repositories:
- HoloInsight
- HoloInsight Agent
- HoloInsight Collector
- HoloInsight AI
- HoloInsight Helm Charts
- HoloInsight Docs
Introduction
This document introduces how to quickly deploy a server-side demo and access it with a browser.
Deploy using docker-compose
We heavily use docker-compose for internal development and E2E testing.
Check more details at Development for testing.
Requirements:
- docker & docker-compose(==v1.29) installed
- Linux or Mac environment
To verify whether docker compose is already installed:
docker-compose version
- Clone the repo
git clone https://github.com/traas-stack/holoinsight.git --depth 1
- Run deploy script
./test/scenes/scene-default/up.sh
This script deploy the whole server side, and it also installs a HoloInsight Agent (VM mode) inside HoloInsight Server container. This usage is only for demonstration and is not applicable to production environment.
#./test/scenes/scene-default/up.sh
Removing network scene-default_default
WARNING: Network scene-default_default not found.
Creating network "scene-default_default" with the default driver
Creating scene-default_agent-image_1 ... done
Creating scene-default_ceresdb_1     ... done
Creating scene-default_mysql_1       ... done
Creating scene-default_mongo_1       ... done
Creating scene-default_prometheus_1  ... done
Creating scene-default_mysql-data-init_1 ... done
Creating scene-default_server_1          ... done
Creating scene-default_finish_1          ... done

[agent] install agent to server
copy log-generator.py to scene-default_server_1
copy log-alert-generator.py to scene-default_server_1

             Name                            Command                  State                                        Ports
---------------------------------------------------------------------------------------------------------------------------------------------------------
scene-default_agent-image_1       true                             Exit 0
scene-default_ceresdb_1           /tini -- /entrypoint.sh          Up (healthy)   0.0.0.0:50171->5440/tcp, 0.0.0.0:50170->8831/tcp
scene-default_finish_1            true                             Exit 0
scene-default_mongo_1             docker-entrypoint.sh mongod      Up (healthy)   0.0.0.0:50168->27017/tcp
scene-default_mysql-data-init_1   /init-db.sh                      Exit 0
scene-default_mysql_1             docker-entrypoint.sh mysqld      Up (healthy)   0.0.0.0:50169->3306/tcp, 33060/tcp
scene-default_prometheus_1        /bin/prometheus --config.f ...   Up             0.0.0.0:50172->9090/tcp
scene-default_server_1            /entrypoint.sh                   Up (healthy)   0.0.0.0:50175->80/tcp, 0.0.0.0:50174->8000/tcp, 0.0.0.0:50173->8080/tcp

Visit server at http://192.168.3.2:50175
Debug server at 192.168.3.2:50174 (if debug mode is enabled)
Exec server using ./server-exec.sh

Visit mysql at 192.168.3.2:50169
Exec mysql using ./mysql-exec.sh
-
Visit HoloInsight at http://192.168.3.2:50175.
Check product documentation -
Stop the deployment
#./test/scenes/scene-default/down.sh
Stopping scene-default_server_1     ... done
Stopping scene-default_prometheus_1 ... done
Stopping scene-default_mysql_1      ... done
Stopping scene-default_mongo_1      ... done
Stopping scene-default_ceresdb_1    ... done
Removing scene-default_finish_1          ... done
Removing scene-default_server_1          ... done
Removing scene-default_mysql-data-init_1 ... done
Removing scene-default_prometheus_1      ... done
Removing scene-default_mysql_1           ... done
Removing scene-default_mongo_1           ... done
Removing scene-default_ceresdb_1         ... done
Removing scene-default_agent-image_1     ... done
Removing network scene-default_default
Deploy using k8s
Now it is recommended to refer to this document to deploy based on K8s
Requirements:
-
k8s cluster
-
Linux or Mac environment
-
clone the repo
git clone https://github.com/traas-stack/holoinsight.git --depth 1
- deploy k8s resources
sh ./deploy/examples/k8s/overlays/example/apply.sh
Notice: Your k8s user must have the permission to create ClusterRole.
Use following script to uninstall HoloInsight from k8s cluster.
# sh ./deploy/examples/k8s/overlays/example/delete.sh
- Visit HoloInsight
Visit http://localhost:8080
Check product documentation
HoloInsight Application Monitoring
HoloInsight application monitoring is a concept very similar to APM, which is designed to help you observe your software performance and related infrastructure, user experience, and business impact from an application perspective.
You can enable HoloInsight Application Monitoring in the following 2 steps:
Then, you can observe your application data on the HoloInsight dashboard:
Send Traces to HoloInsight
Before this you need to deploy the HoloInsight collector.
Report the trace data to the HoloInsight collector for processing and export to the HoloInsight server, and then you can view the distributed trace links, service topology, and aggregated statistical indicators on the HoloInsight dashboard.
The HoloInsight collector receives trace data based on the OpenTelemetry specification, which means that you can use almost any open-source SDK (OTel, SkyWalking, etc.) to collect data and report it uniformly, depending on your software environment and programming language.
How to configure
The
YOUR_APPLICATION_NAMEmentioned below is used to identify theapplication(aka theservice), which should be the same as the application name specified by-awhen installing HoloInsight Agent.
Using OTel SDK
To be added.
Using SkyWalking Agent
If your application is deployed in a container
- You can build your image based on the officially recommended image carrying SkyWalking Agent.
FROM apache/skywalking-java-agent:8.15.0-java8

ENV SW_AGENT_NAME ${YOUR_APPLICATION_NAME}
ENV SW_AGENT_AUTHENTICATION ${YOUR_HOLOINSIGHT_API_KEY}
ENV SW_AGENT_COLLECTOR_BACKEND_SERVICES ${YOUR_HOLOINSIGHT_COLLECTOR_ADDRESS}

# ... build your java application

# You can start your Java application with `CMD` or `ENTRYPOINT`,
# but you don't need to care about the Java options to enable SkyWalking agent,
# it should be adopted automatically.
- Or you can manually download the SkyWalking Agent and attach it to your application startup command in the Dockerfile.
RUN wget https://archive.apache.org/dist/skywalking/java-agent/8.15.0/apache-skywalking-java-agent-8.15.0.tgz
RUN tar zxvf apache-skywalking-java-agent-8.15.0.tgz

ENV SW_AGENT_NAME ${YOUR_APPLICATION_NAME}
ENV SW_AGENT_AUTHENTICATION ${YOUR_HOLOINSIGHT_API_KEY}
ENV SW_AGENT_COLLECTOR_BACKEND_SERVICES ${YOUR_HOLOINSIGHT_COLLECTOR_ADDRESS}

... build your java application

CMD ["java", "-javaagent:PATH/TO/YOUR/SKYWALKING-AGENT/skywalking-agent/agent/skywalking-agent.jar", ${YOUR_APPLICATION_STARTUP_PARAMS}]
If your application is deployed on a host
- Download and unzip the SkyWalking Agent
wget https://archive.apache.org/dist/skywalking/java-agent/8.15.0/apache-skywalking-java-agent-8.15.0.tgz
tar zxvf apache-skywalking-java-agent-8.15.0.tgz
- Edit the
skywalking-agent/config/agent.config
agent.service_name=${YOUR_APPLICATION_NAME}
agent.authentication=${YOUR_HOLOINSIGHT_API_KEY}
collector.backend_service=${YOUR_HOLOINSIGHT_COLLECTOR_ADDRESS}
- Enable SkyWalking Agent in the startup command
java -javaagent:PATH/TO/YOUR/SKYWALKING-AGENT/skywalking-agent/agent/skywalking-agent.jar ${YOUR_APPLICATION_STARTUP_PARAMS}
Service Topology
HoloInsight Service Topology builds service topology from multiple perspectives such as tenants, applications, interfaces, instances, and components, helping you quickly inspect your global architecture and traffic distribution.
A service topology consists of nodes and edges. A node represents the service overview provided by the resources it describes, and an edge represents the calling relationship between two specific nodes.
You can inspect the topology of all applications from the perspective of tenants.

And you can also focus on a certain application, interface or instance, and inspect their upstream and downstream based on the view depth you choose.

APM Metric Data
The APM metric data is calculated based on the reported trace details and is used to measure the health status of the application from a statistical point of view. It mainly includes two types of indicators:
- Request quantity: including total amount, failure amount, and success rate.
- Request latency: including average latency and latency quantile.

Data Pre-aggregation
It is inefficient to compute aggregated data from the vast amount of trace details each time. It takes time to respond quickly, especially in scenarios with high real-time requirements(e.g. alert calculation) or long-term queries (e.g. the latency trend of an interface in the past week).
HoloInsight adopts the pre-aggregation method to aggregate trace details into materialized metric data in advance and write them into the time-series database, improving query performance and timeliness and providing conditions for long-term retention of trend data.
Distributed Tracing
Distributed tracing allows you to filter out the call chains you are interested in based on specified conditions and drill down to view the operation of a call across multiple microservices.

And select a trace to drill down to see how it performs across multiple microservices.

Downstream Components
The Downstream Components inspects the invoked downstream components from the perspective of the current application (that is, the client perspective), such as databases, caches, message queues, etc.
To de added.
Slow SQL Monitoring
To de added.
HoloInsight Log Monitoring
Log data naturally has good characteristics.
- First of all, logs are very structured data that grows over time and is persistent on disk, which has very good fault tolerance for users.
- Secondly, the log is very good to shield the difference of the system itself, whether it is a system developed in Java or a system written in Python or C++, after the log disk is homogeneous data, there is no need to adapt the observation system.
- Third, log-based observation is non-intrusive, there is no need to connect the third-party SDK to the business process, and effectively prevent various performance, stability, security and other concerns brought about by external code intrusion.
HoloInsight allows you to monitor logs, freely count the required indicators, combine and calculate them, and generate the necessary data and reports. This tutorial explains how to use log monitoring. Create log monitoring
The specific flow diagram can be seen in the following figure

There are also some higher-order features:
Create log monitoring
Log monitoring is a general term for various customized and personalized data access methods. You can use custom monitoring to access various types of log data sources, collect required indicators, combine and calculate them, and generate required data and reports. You can also configure alarms for monitoring items to learn about data anomalies in time and handle them accordingly.
This section describes how to create a log monitoring.
Step 1: Create log monitoring
- Log on to the HoloInsight Monitoring Console and click Log monitoring in the left navigation bar.
- Add monitoring
There are two methods for adding a monitor. You can select one based on your requirements.
- Method 1: Click Add in the upper right corner to add a monitor.
- Method 2: Tap Create folder, to add a monitor in the folder.

Step 2: Configure log monitoring
Configuring log monitoring includes Basic configuration, Log extraction, and Metric definition.
Basic configuration

-
Name: The name of log monitor.
-
Online status: The status of the acquisition configuration, online status is valid.
-
Acquisition period: The default is 1min, and users can adjust it as needed.
-
Type filtering: Filter the range of acquisition.
-
Log path:
- Support absolute path.
- Support regex to match log path.
- Support matching log paths that contain variables. Currently only date variables are supported.
Extract logs
- Extract online logs
- Pull online log: Tap the Refresh icon to pull online logs again.

-
Edit online log source: Click the** Edit **icon to select the log sample source, either Online logs or Manual input.
i. Select Online log, follow the steps below to configure it.
- In the Specify server IP text box field, enter the IP address.
- Fill in the corresponding description content in the Log sample.
- Click OK, so the online log is pulled successfully.
ii:Select Manual input, Perform the following steps to configure:

- Fill in the description content in the Log input.
- Tap OK. The online log is pulled successfully.
-
Configure the log distribution
Logs distributed in multiple lines: Choose yes or no.
- Select No: no configuration is required.
- Select Yes: follow the steps below to configure it.
- Select Specify location text box head line or end of line to of the log.
- Enter a regexp in the Regular expression text box to describe header or footer of the log, easier for the Agent to cut the log.

- Configure log prefilter
Log pre-filtering: Select whether to enable the log pre-filtering function.
- Disable the log prefilter function. No configuration is required.
- Enable the log prefilter function. Follow the steps below to configure it:
- In the Preceding rules, click Add filter rule. Add column definition panel pops up.

- In the Add column definition panel, select Filter rules, you can match keywords or filter from left to right.
- Match Keywords
- From left to right
- Segmentation rules
There are four types of segment rules. You can choose the one right for your needs.
-
From left to right
- In the Segmentation method selection bar, click From left to right.
- Click Add segmentation rule to jump to the Add column definition panel.

-
Complete information under the Add column definition panel and click Confirm.
-
Click Add in the Column configuration field to enter the Edit column configuration panel and edit the column configuration.
-
After editing the Edit Column Configuration panel, click OK. The configuration of segmentation rule of from left to right is complete.

-
By separator
i. In the segmentation method selectionbar, click By separator, and separator text box pops up. ⅱ. Enter the separator in the separator text box and click Confirm Segmentation. ⅲ. Click Add in the** Column Configuration** column to define the column value for the field after segmentation.

-
By regex
i. Under segment mode selectionbar, click By regex, and regular expression text box pops up. ⅱ. In the Regular expreession text box, enter the regexp and Click Segment. d. Skip segmentation In the column for selecting a segment mode, click** Skip**.
Definition of metrics
- Click Add Monitoring metrics to slide out the** Add monitoring metric **panel on the right.

- On the Add monitoring metrics page, fill in configuration info.
- Name: Enter the name of the new monitoring metric.
- Metric definition: Select the desired metric definition. ▪ Log traffic: Monitor by log traffic. ▪ Keyword count: Monitor the metric by entering keywords and performing counting. ▪ Numerical Extraction: Monitor numerical metrics by entering the corresponding numerical values.

- After filling it, click Save.
Step 3: View data
- On the left navigation bar, select Log monitoring and click Monitoring configuration. The** Data preview** page is displayed.

- On the** Data preview** page, you can view data.
Key word count
There are two ways to monitor keyword matches
Method 1
- Matching is performed by pre-filtering

- Then find the number of rows in the indicator configuration

Method 2
You can configure the keyword line count during counter configuration

Log folder
Add folder, and move a monitor in the folder.


Dim translate
Fields that are shred for log monitoring can be converted to easy-to-understand strings using conversion functions
The conversion function can do elect (shred) out of the field to continue to do the conversion, the process is similar to the unix pipeline.
pipeline = echo x | filter1 arg0 | filter2 arg1 arg2 | filter3 arg3
Here we support 5 conversion functions
- @append
- doc: Append content to the string
- params:
- value: content string
- @mapping
- doc: Replace the sliced string with a new string
- params:
- value: Map string
- @regexp
- doc: Replace the sliced string that satisfies the regular expression with a new string
- params:
- value: Map string
- @contains
- doc: Replace the sliced string containing the keyword with a new string
- params:
- value: Map string
- @const
- doc: Replace the sliced string containing the keyword with a constant string
- params:
- value: const string

Use Case
Case1 : Column Value Translation
filters:
- switchCaseV1:
  	cases:
    - caseWhere:
        regexp:
          pattern: "^hello (.*)$"
          catchGroups: true
      action:
      	regexpReplace1: "your name is $1"
    - caseWhere:
        regexp:
          pattern: "^login (.*)$"
          catchGroups: true
      action:
      	const:
      		value: "user login"
   defaultAction:
     const: "unknown"
Case2 : Mapping
filters:
- switchCaseV1:
  	cases:
    - caseWhere:
        eq:
          value: "a"
      action:
      	const: "1"
    - caseWhere:
       eq:
         value: "b"
      action:
      	const: "2"
     - caseWhere:
       eq:
         value: "c"
      action:
      	const: "3"
   defaultAction:
     const: "unknown"
The meaning of this configuration is
var map = {"a":"1","b":"2","c":"3"}
var v, exist = map[x]
if !exist {
  v = "unknown"
}
Post filtering
You can perform post-filtering for the indicator table composed of the segmented dimensions and indicators.

Log pattern
Pattern matching is a user-defined monitoring plugin. It monitors and collects statistics on keywords that are not in fixed positions in logs. For example, it collects statistics on certain errors in Error logs. Pattern matching is mostly used for logs with irregular formats, such as logs without dates.
Use Case
- Collect the number of logs that match a Pattern
- Intelligent clustering is performed according to log similarity, and the number of keyword occurrences in intelligent clustering is counted
- Storage keeps some log samples
Step1
- select Logpattern statistics
- Two methods are supported:
- One is to generate event codes based on keywords matching log content.
- The other supports log generated event codes that satisfy regular expressions.

Step2
When configuring indicators, you need to select a mode matching mode

Step3
Placing the mouse over the number brings up the sampling event.

Config Meta
{
  "select": {
    "values": [
      {
        "as": "value",
        "_doc": "对于 loganalysis 必须这么写",
        "agg": "loganalysis"
      }
    ]
  },
  "from": {
    "type": "log",
    "log": {
      "path": [
        {
          "type": "path",
          "pattern": "/home/admin/logs/gateway/common-default.log"
        }
      ],
      "charset": "utf-8"
    }
  },
  # where 依旧可以用来过滤日志
  "where": {
    "in": {
      "elect": {
        "type": "refIndex",
        "refIndex": {
          "index": 2
        }
      },
      "values": [
        "INFO"
      ]
    }
  },
  "groupBy": {
    "loganlysis": {
    	# 此处对应上面的 Conf
      "patterns": [{
        "name": "io exception",
        "where": {
          "contains": {
            "elect": {
				"type" : "line",
            },
            "value": "IOException"
          }
        },
        "maxSnapshots": 3
      }, {
        "name": "runtime exception",
        "where": {
          "contains": {
            "elect": {
				"type" : "line",
            },
            "value": "RuntimeException"
          }
        },
        "maxSnapshots": 3
      }],
      "maxSnapshots"`: 3,
      "maxUnknownPatterns": 10,
      "maxKeywords": 50
  	},

  },
  "window": {
    "interval": "1m"
  },
  "executeRule": {
  },
  "output": {
    "type": "cmgateway",
    "cmgateway": {
      "metricName": "metric_table"
    }
  }
}
Query Data
Logs are stored in: ${metricName}_analysis, Its value is a json string with the following format.
{
  "samples": ["line1", "line2", "line3"],
  "maxCount": 10
}
Case1: UnKnow Pattern
# REQUEST
curl -l -H "Content-type: application/json" -H "accessKey: test"  -X POST http://127.0.0.1:8080/webapi/v1/query -d'
{
  "datasources": [
    {
      "metric": "loganalysis_analysis",
      "start": 1670505300000,
      "end": 1670505360000,
      "filters": [
        {
          "type": "literal",
          "name": "eventName",
          "value": "__analysis"
        }
      ],
      "aggregator": "unknown-analysis",
      "groupBy": [
        "app",
        "eventName"
      ]
    }
  ]
}

#  RESPONSE
{
  "success": true,
  "message": null,
  "resultCode": null,
  "data": {
    "results": [
      {
        "metric": "loganalysis_analysis",
        "tags": {
          "app": "holoinsight-server"
        },
        "values": [
          [
            1670505350000,
            "{\"mergeData\":{\"analyzedLogs\":[{\"parts\":[{\"content\":\"INFO\",\"source\":false,\"important\":false,\"count\":1},{\"content\":\"scheduling-1\",\"source\":false,\"important\":false,\"count\":1},{\"content\":\"i.h.s.g.c.a.TenantService\",\"source\":false,\"important\":false,\"count\":1},{\"content\":\"tenant\",\"source\":false,\"important\":false,\"count\":1},{\"content\":\"size\",\"source\":false,\"important\":false,\"count\":1},{\"content\":\"52\",\"source\":false,\"important\":false,\"count\":1},{\"content\":\"cost\",\"source\":false,\"important\":false,\"count\":1},{\"content\":\"1\",\"source\":false,\"important\":false,\"count\":1}],\"sample\":\"2022-12-08 21:15:52,000 INFO  [scheduling-1] i.h.s.g.c.a.TenantService - [tenant] size=[52] cost=[1]\",\"ipCountMap\":{\"holoinsight-server-1\":1},\"count\":1},{\"parts\":[{\"content\":\"INFO\",\"source\":false,\"important\":false,\"count\":1},{\"content\":\"scheduling-1\",\"source\":false,\"important\":false,\"count\":1},{\"content\":\"i.h.s.c.a.ApikeyService\",\"source\":false,\"important\":false,\"count\":1},{\"content\":\"apikey\",\"source\":false,\"important\":false,\"count\":1},{\"content\":\"size\",\"source\":false,\"important\":false,\"count\":1},{\"content\":\"56\",\"source\":false,\"important\":false,\"count\":1},{\"content\":\"cost\",\"source\":false,\"important\":false,\"count\":1},{\"content\":\"2\",\"source\":false,\"important\":false,\"count\":1}],\"sample\":\"2022-12-08 21:15:52,017 INFO  [scheduling-1] i.h.s.c.a.ApikeyService - [apikey] size=[56] cost=[2]\",\"ipCountMap\":{\"holoinsight-server-1\":1},\"count\":1}]},\"ipCountMap\":{\"holoinsight-server-1\":2}}"
          ]
        ]
      },
      {
        "metric": "loganalysis_analysis",
        "tags": {
          "app": "holoinsight-server"
        },
        "values": [
          [
            1670505315000,
            "{\"mergeData\":{\"analyzedLogs\":[{\"parts\":[{\"content\":\"INFO\",\"source\":false,\"important\":false,\"count\":1},{\"content\":\"grpc-for-agent-2\",\"source\":false,\"important\":false,\"count\":1},{\"content\":\"i.h.s.r.c.m.MetaSyncService\",\"source\":false,\"important\":false,\"count\":1},{\"content\":\"curd detail\",\"source\":false,\"important\":true,\"count\":1},{\"content\":\"need compare\",\"source\":false,\"important\":true,\"count\":1},{\"content\":\"14\",\"source\":false,\"important\":false,\"count\":1}],\"sample\":\"2022-12-08 21:15:17,343 INFO  [grpc-for-agent-2] i.h.s.r.c.m.MetaSyncService - curd detail, need compare: 14\",\"ipCountMap\":{\"holoinsight-server-1\":3},\"count\":3}]},\"ipCountMap\":{\"holoinsight-server-1\":3}}"
          ]
        ]
      },
      {
        "metric": "loganalysis_analysis",
        "tags": {
          "app": "holoinsight-server"
        },
        "values": [
          [
            1670505345000,
            "{\"mergeData\":{\"analyzedLogs\":[{\"parts\":[{\"content\":\"INFO\",\"source\":false,\"important\":false,\"count\":1},{\"content\":\"scheduling-1\",\"source\":false,\"important\":false,\"count\":1},{\"content\":\"i.h.s.g.c.a.TenantService\",\"source\":false,\"important\":false,\"count\":1},{\"content\":\"tenant\",\"source\":false,\"important\":false,\"count\":1},{\"content\":\"size\",\"source\":false,\"important\":false,\"count\":1},{\"content\":\"52\",\"source\":false,\"important\":false,\"count\":1},{\"content\":\"cost\",\"source\":false,\"important\":false,\"count\":1},{\"content\":\"1\",\"source\":false,\"important\":false,\"count\":1}],\"sample\":\"2022-12-08 21:15:46,419 INFO  [scheduling-1] i.h.s.g.c.a.TenantService - [tenant] size=[52] cost=[1]\",\"ipCountMap\":{\"holoinsight-server-0\":1},\"count\":1},{\"parts\":[{\"content\":\"INFO\",\"source\":false,\"important\":false,\"count\":1},{\"content\":\"scheduling-1\",\"source\":false,\"important\":false,\"count\":1},{\"content\":\"i.h.s.c.a.ApikeyService\",\"source\":false,\"important\":false,\"count\":1},{\"content\":\"apikey\",\"source\":false,\"important\":false,\"count\":1},{\"content\":\"size\",\"source\":false,\"important\":false,\"count\":1},{\"content\":\"56\",\"source\":false,\"important\":false,\"count\":1},{\"content\":\"cost\",\"source\":false,\"important\":false,\"count\":1},{\"content\":\"2\",\"source\":false,\"important\":false,\"count\":1}],\"sample\":\"2022-12-08 21:15:46,437 INFO  [scheduling-1] i.h.s.c.a.ApikeyService - [apikey] size=[56] cost=[2]\",\"ipCountMap\":{\"holoinsight-server-0\":1},\"count\":1}]},\"ipCountMap\":{\"holoinsight-server-0\":2}}"
          ]
        ]
      }
    ]
  }
}
Case2: Known Pattern
#  REQUEST

curl -l -H "Content-type: application/json" -H "accessKey: xiangfengtest"  -X POST http://127.0.0.1:8080/webapi/v1/query -d'
{
  "datasources": [
    {
      "metric": "loganalysis_analysis",
      "start": 1670505300000,
      "end": 1670505360000,
      "filters": [
        {
          "type": "not_literal",
          "name": "eventName",
          "value": "__analysis"
        }
      ],
      "aggregator": "known-analysis",
      "groupBy": [
        "app",
        "eventName"
      ]
    }
  ]
}
'

#  RESPONSE
{
  "success": true,
  "message": null,
  "resultCode": null,
  "data": {
    "results": [
      {
        "metric": "loganalysis_analysis",
        "tags": {
          "app": "holoinsight-server",
          "hostname": "holoinsight-server-0",
          "pod": "holoinsight-server-0",
          "namespace": "holoinsight-server",
          "eventName": "DimDataWriteTask"
        },
        "values": [
          [
            1670505310000,
            "{\"analyzedLogs\":[{\"sample\":\"2022-12-08 21:15:11,971 INFO  [pool-8-thread-1] i.h.s.r.c.a.DimDataWriteTask - async-executor monitor. taskCount:8685, completedTaskCount:8682, largestPoolSize:12, poolSize:12, activeCount:1,queueSize:2\",\"count\":4}]}"
          ],
          [
            1670505340000,
            "{\"analyzedLogs\":[{\"sample\":\"2022-12-08 21:15:41,971 INFO  [pool-8-thread-1] i.h.s.r.c.a.DimDataWriteTask - async-executor monitor. taskCount:8836, completedTaskCount:8833, largestPoolSize:12, poolSize:12, activeCount:1,queueSize:2\",\"count\":4}]}"
          ]
        ]
      },
      {
        "metric": "loganalysis_analysis",
        "tags": {
          "app": "holoinsight-server",
          "hostname": "holoinsight-server-1",
          "pod": "holoinsight-server-1",
          "namespace": "holoinsight-server",
          "eventName": "DimDataWriteTask"
        },
        "values": [
          [
            1670505315000,
            "{\"analyzedLogs\":[{\"sample\":\"2022-12-08 21:15:15,915 INFO  [pool-8-thread-5] i.h.s.r.c.a.DimDataWriteTask - async-executor monitor. taskCount:6759, completedTaskCount:6756, largestPoolSize:12, poolSize:12, activeCount:1,queueSize:2\",\"count\":7}]}"
          ],
          [
            1670505345000,
            "{\"analyzedLogs\":[{\"sample\":\"2022-12-08 21:15:45,915 INFO  [pool-8-thread-2] i.h.s.r.c.a.DimDataWriteTask - async-executor monitor. taskCount:6910, completedTaskCount:6907, largestPoolSize:12, poolSize:12, activeCount:1,queueSize:2\",\"count\":4}]}"
          ]
        ]
      },
      {
        "metric": "loganalysis_analysis",
        "tags": {
          "app": "holoinsight-server",
          "hostname": "holoinsight-server-0",
          "pod": "holoinsight-server-0",
          "namespace": "holoinsight-server",
          "eventName": "RegistryServiceForAgentImpl"
        },
        "values": [
          [
            1670505310000,
            "{\"analyzedLogs\":[{\"sample\":\"2022-12-08 21:15:10,361 INFO  [grpc-for-agent-7] i.h.s.r.c.g.RegistryServiceForAgentImpl - agent=685f6941-5ccd-48a4-a939-cc23b0591252 keys=9 missDim=0 tasks=9\",\"count\":7}]}"
          ],
          [
            1670505325000,
            "{\"analyzedLogs\":[{\"sample\":\"2022-12-08 21:15:25,613 INFO  [grpc-for-agent-0] i.h.s.r.c.g.RegistryServiceForAgentImpl - agent=43f2c31f-0c8f-4e7f-b0c3-86ede2c06693 keys=16 missDim=0 tasks=16\",\"count\":2}]}"
          ]
        ]
      },
      {
        "metric": "loganalysis_analysis",
        "tags": {
          "app": "holoinsight-server",
          "hostname": "holoinsight-server-1",
          "pod": "holoinsight-server-1",
          "namespace": "holoinsight-server",
          "eventName": "RegistryServiceForAgentImpl"
        },
        "values": [
          [
            1670505305000,
            "{\"analyzedLogs\":[{\"sample\":\"2022-12-08 21:15:10,161 INFO  [grpc-for-agent-2] i.h.s.r.c.g.RegistryServiceForAgentImpl - agent=e5062aea-dec7-4ded-98f3-6bd951146276 keys=0 missDim=0 tasks=0\",\"count\":1}]}"
          ],
          [
            1670505310000,
            "{\"analyzedLogs\":[{\"sample\":\"2022-12-08 21:15:10,370 INFO  [grpc-for-agent-3] i.h.s.r.c.g.RegistryServiceForAgentImpl - agent=5fdafdda-960c-4f09-bc91-1e9f195db14e keys=13 missDim=0 tasks=13\",\"count\":4}]}"
          ],
          [
            1670505320000,
            "{\"analyzedLogs\":[{\"sample\":\"2022-12-08 21:15:22,704 INFO  [grpc-for-agent-3] i.h.s.r.c.g.RegistryServiceForAgentImpl - agent=a354aaa1-11fe-4e11-a7c1-56147e99181d keys=14 missDim=0 tasks=14\",\"count\":1}]}"
          ],
          [
            1670505325000,
            "{\"analyzedLogs\":[{\"sample\":\"2022-12-08 21:15:26,297 INFO  [grpc-for-agent-5] i.h.s.r.c.g.RegistryServiceForAgentImpl - agent=d2f6f05a-7ba3-4293-83f3-2e76eb6db013 keys=16 missDim=0 tasks=16\",\"count\":1}]}"
          ]
        ]
      }
    ]
  }
}
Log sample
Log sampling is based on user-defined log monitoring and retains several logs that cause the indicator to be generated.
-
For example, you now have a custom monitor with the following metrics:
- time=2023-05-29 16:01:00
- dim={"code":500, "url": "www.example.com"}
- value=2
-
There are now two logs that cause this indicator to be generated. You now want to keep up to one such log.
2023-05-29 16:01:03 xxxxxLONG_TRACE_IDxxxxxxx code=500 url=www.example.com reason= long long timeout
Config
Step 1 : EDIT
When configuring counters, add sampling conditions to perform log sampling

Step 2 : VIEW
Placing the mouse over the number brings up the sampling event.

Config Meta
Add the logSamples field in select, based on a normal custom log monitoring configuration.
{
  "select": {
    "values":[...]
    # if logSamples == nil or !enabled , indicates that sampling is not started
    "logSamples": {
      "enabled" true,
      "where": {...满足该where条件的日志才会被采样...},
      "maxCount": 10, # 单机最多采样10条, 因为我们只能做到单机粒度, 建议暂时别开放给用户去配置, 设置为1就行了
      "maxLength": 4096, 日志如果超过4096, 会被截断
    }
  }
}
Query Data
Logs are stored in: ${metricName}_logsamples, Its value is a json string with the following format.
{
  "samples": ["line1", "line2", "line3"],
  "maxCount": 10
}
Case1 : Query Server
# REQUEST
curl -l -H "Content-type: application/json"  -X POST http://127.0.0.1:8080/cluster/api/v1/query/data -d'{"tenant":"aliyundev","datasources":[{"start":1686733260000,"end":1686733320000,"name":"a","metric":"count_logsamples","aggregator":"none"}],"query":"a"}'
# RESPONSE

{
  "results": [{
    "metric": "a",
    "tags": {
      "app": "holoinsight-server",
      "path": "/webapi/meta/queryByTenantApp",
      "hostname": "holoinsight-server-0",
      "workspace": "default",
      "pod": "holoinsight-server-0",
      "ip": "ip1",
      "namespace": "holoinsight-server"
    },
    "points": [{
      "timestamp": "1686733260000",
      "strValue": "{\"maxCount\":1,\"samples\":[{\"hostname\":\"\",\"logs\":[[\"2023-06-14 17:01:51,745 INFO [http-nio-8080-exec-1] i.h.s.h.w.f.Step4AccessLogFilter - trace,tenant\u003daliyundev,accessKey\u003d-,client\u003d100.127.133.174,path\u003d/webapi/meta/queryByTenantApp,method\u003dPOST,status\u003d200,size\u003d9827,cost\u003d3ms,\"]]}]}"
    }]
  }]
}
Case2 : Query App
# REQUEST
curl -l -H "Content-type: application/json"  -X POST http://127.0.0.1:8080/cluster/api/v1/query/data -d'{"tenant":"aliyundev","datasources":[{"start":1686733260000,"end":1686733320000,"name":"a","metric":"count_logsamples", "groupBy":["app"], "aggregator":"sample"}],"query":"a"}'

# RESPONSE
{
  "results": [{
    "metric": "a",
    "tags": {
      "app": "holoinsight-server"
    },
    "points": [{
      "timestamp": "1686733260000",
      "strValue": "{\"samples\":[{\"hostname\":\"holoinsight-server-0\",\"logs\":[[\"2023-06-14 17:01:51,745 INFO [http-nio-8080-exec-1] i.h.s.h.w.f.Step4AccessLogFilter - trace,tenant\u003daliyundev,accessKey\u003d-,client\u003d100.127.133.174,path\u003d/webapi/meta/queryByTenantApp,method\u003dPOST,status\u003d200,size\u003d9827,cost\u003d3ms,\"]]}],\"maxCount\":1}"
    }]
  }]
}
Resource Evaluation
Originally, only one float64/double value was needed for each dimension, but now there are several additional sample logs, which are obviously much larger than the data (a 1KB log is 128 times more expensive than a double!). Therefore, the pressure on the database will be much greater. It is recommended to configure sampleWhere properly, such as sampling only error cases
Integrations
This is a guide to using integration, including integration component libraries and monitoring markets. See the detailed documentation for how to use integration
Integrated component library
JVM performance monitor
Go to http://localhost:8080/integration/agentComp?tenant=default.
Install the JVM integration component with application in [holoinsight-server, holoinsight-demo-server, holoinsight-demo-client] (for example).
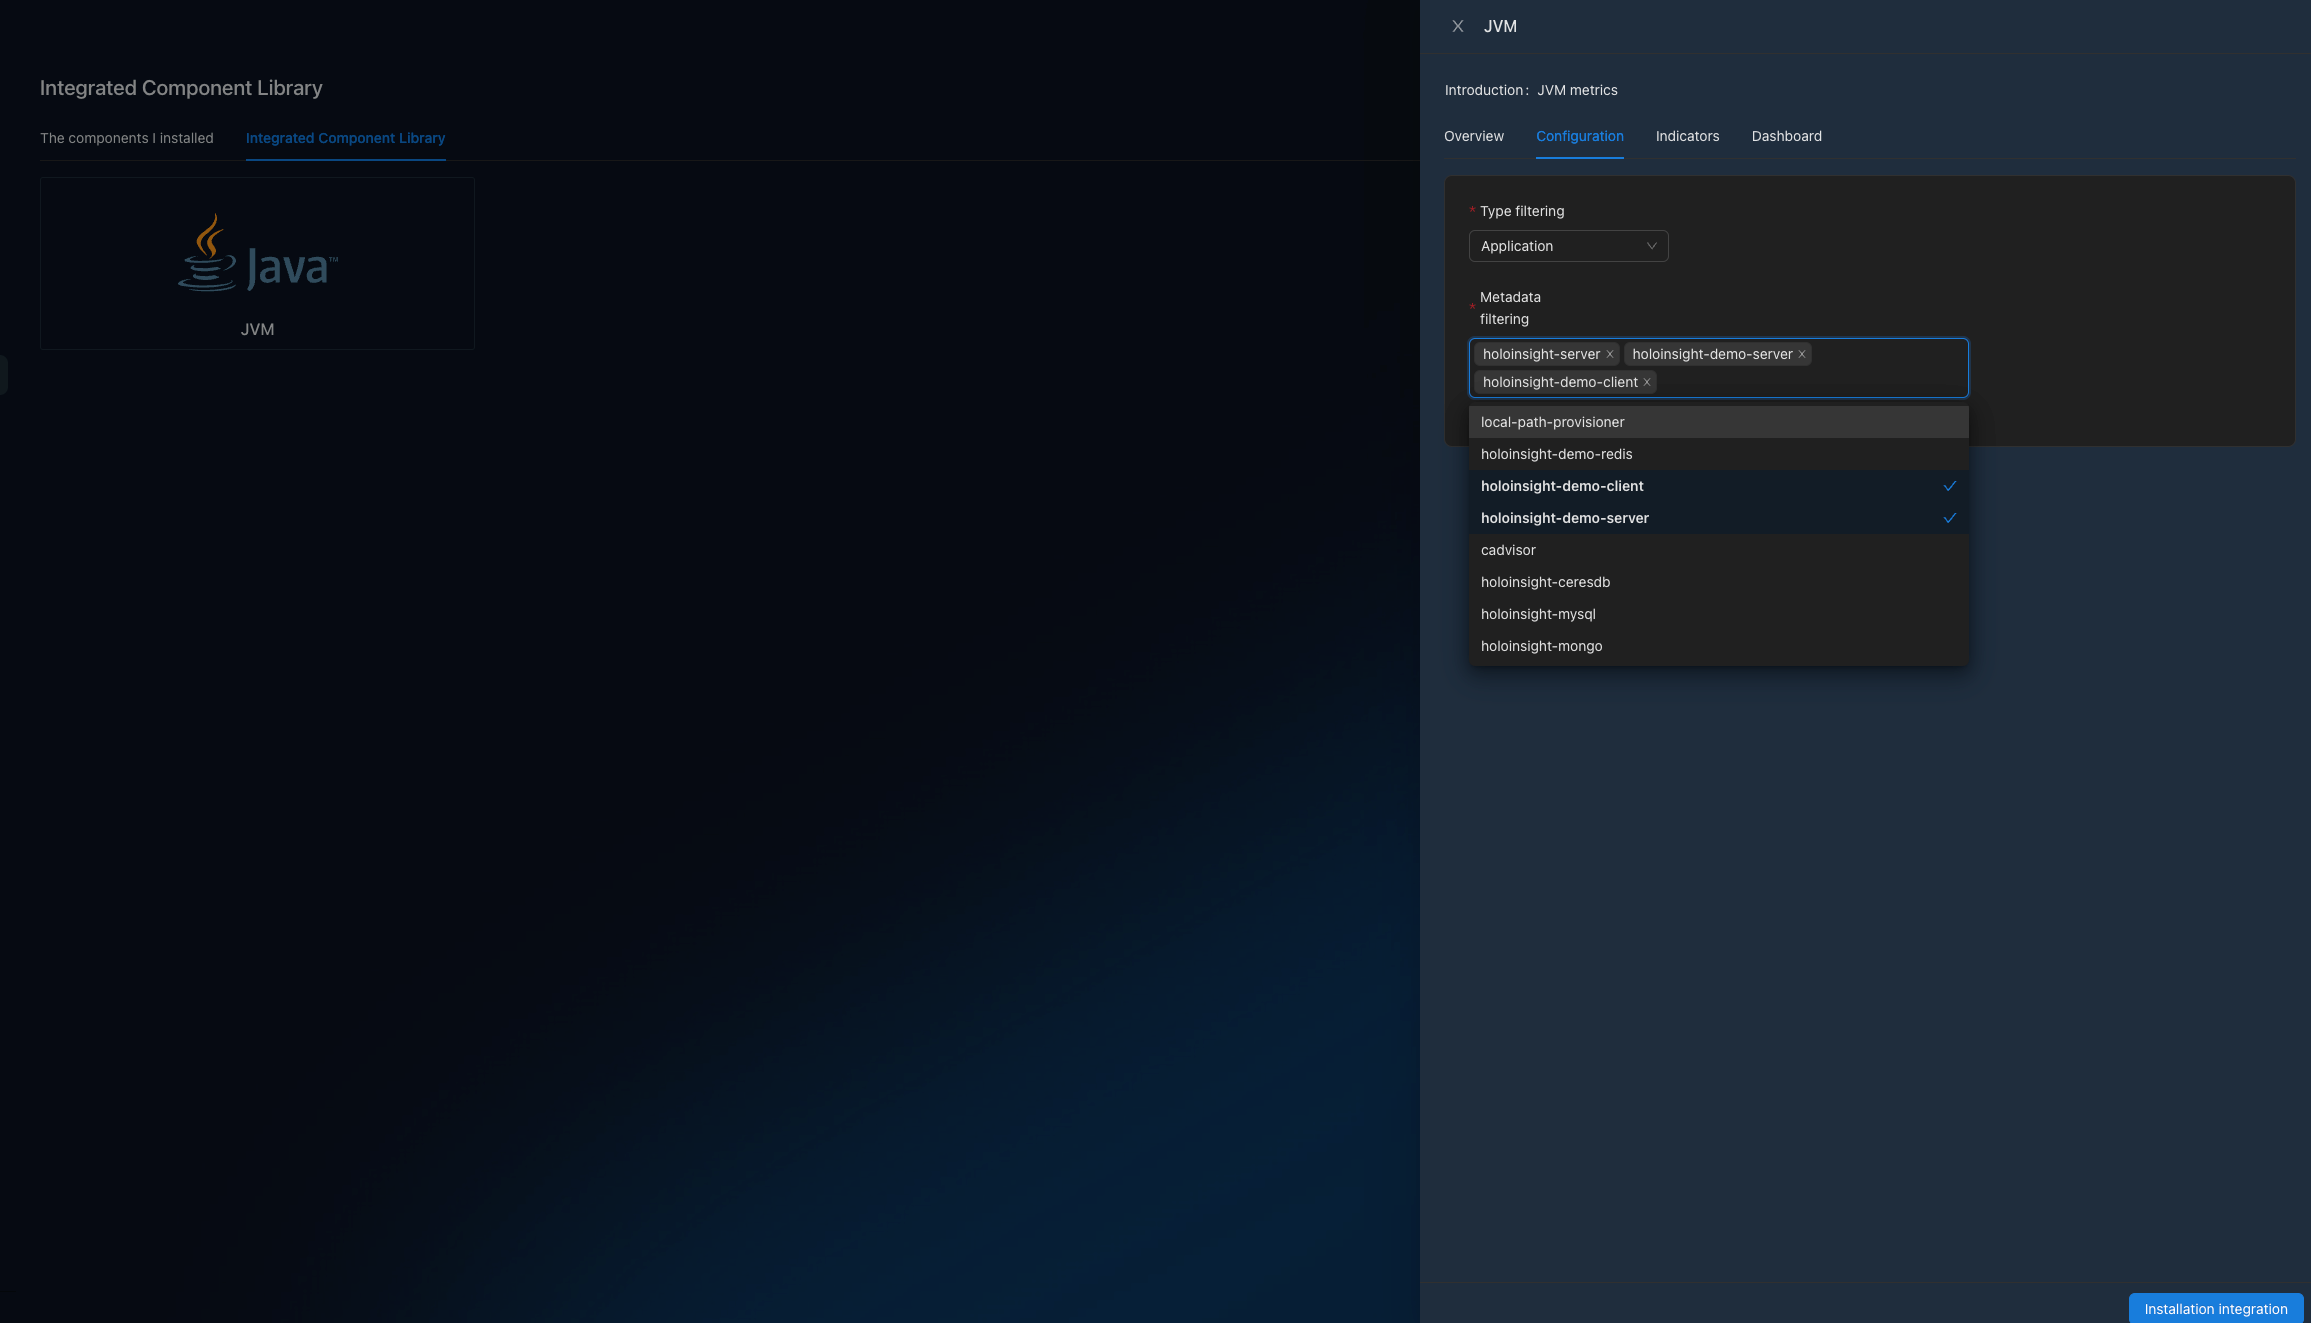
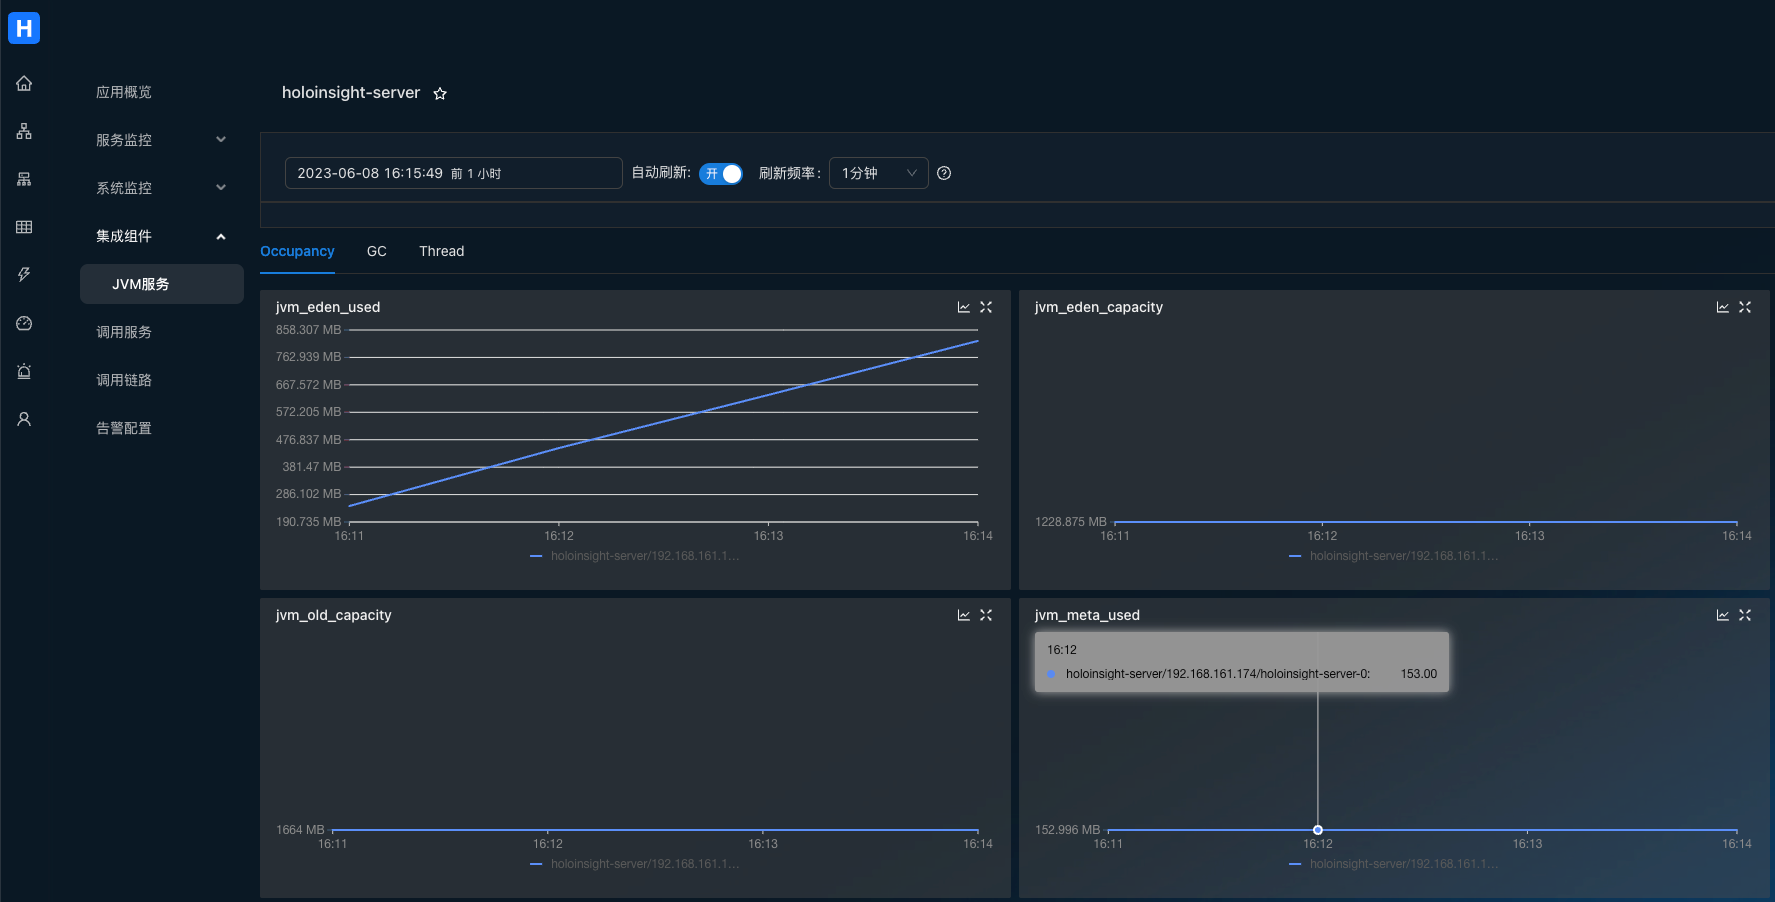
Wait a few minutes.
Visit http://localhost:8080/app/dashboard/jvm?app=holoinsight-server&id=6&tenant=default
OpenAIMonitor plugin
Configure environment variables in the environment of your service
export DD_SERVICE="your_app_name"
Import ddtrace package in the OpenAI code
pip install ddtrace>=1.13
Below is a code sample that you can run directly to test
import openai
from flask import Flask
from ddtrace import tracer, patch

app = Flask(__name__)
tag = {
    'env': 'test',
    'tenant': 'default', # Configuring tenant information
    'version': 'v0.1'
}
# Set the Collector_DataDog address and port
tracer.configure(
    hostname='localhost',
    port='5001'
)
tracer.set_tags(tag)
patch(openai=True)

@app.route('/test/openai')
def hello_world():
    openai.api_key = 'sk-***********' # Enter the openai api_key
    openai.proxy = '*******'          # Configure proxy addresses as required
    return ChatCompletion('gpt-3.5-turbo')


def ChatCompletion(model):
    content = 'Hello World!'
    messages = [{'role': 'user', 'content': content}]
    result = openai.ChatCompletion.create(api_key=openai.api_key, model=model, messages=messages)
    print('prompt_tokens: {}, completion_tokens: {}'.format(result['usage']['prompt_tokens'],
                                                         result['usage']['completion_tokens']))
    return result

def Completion(engine):
    content = 'Hello World!'
    result = openai.Completion.create(engine=engine, prompt=content, max_tokens=50)
    print('prompt_tokens: {}, completion_tokens: {}'.format(result['usage']['prompt_tokens'],
                                                            result['usage']['completion_tokens']))
    return result


if __name__ == '__main__':
    app.run(port=5002)
Calling interface
curl --location --request GET 'localhost:5002/test/openai'
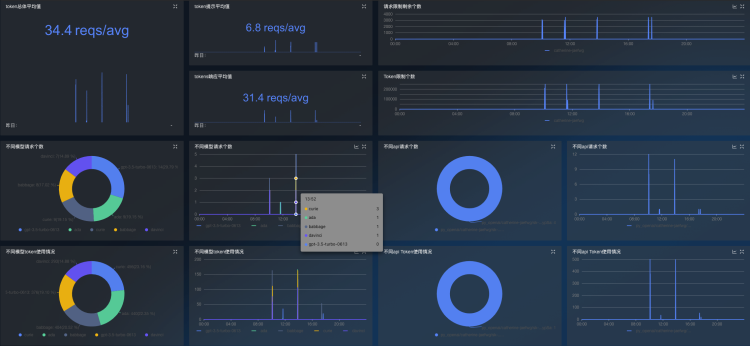
Open page http://localhost:8080/integration/agentComp?tenant=default.
Install the OpenAIMonitor plug-in on the Integration Components page
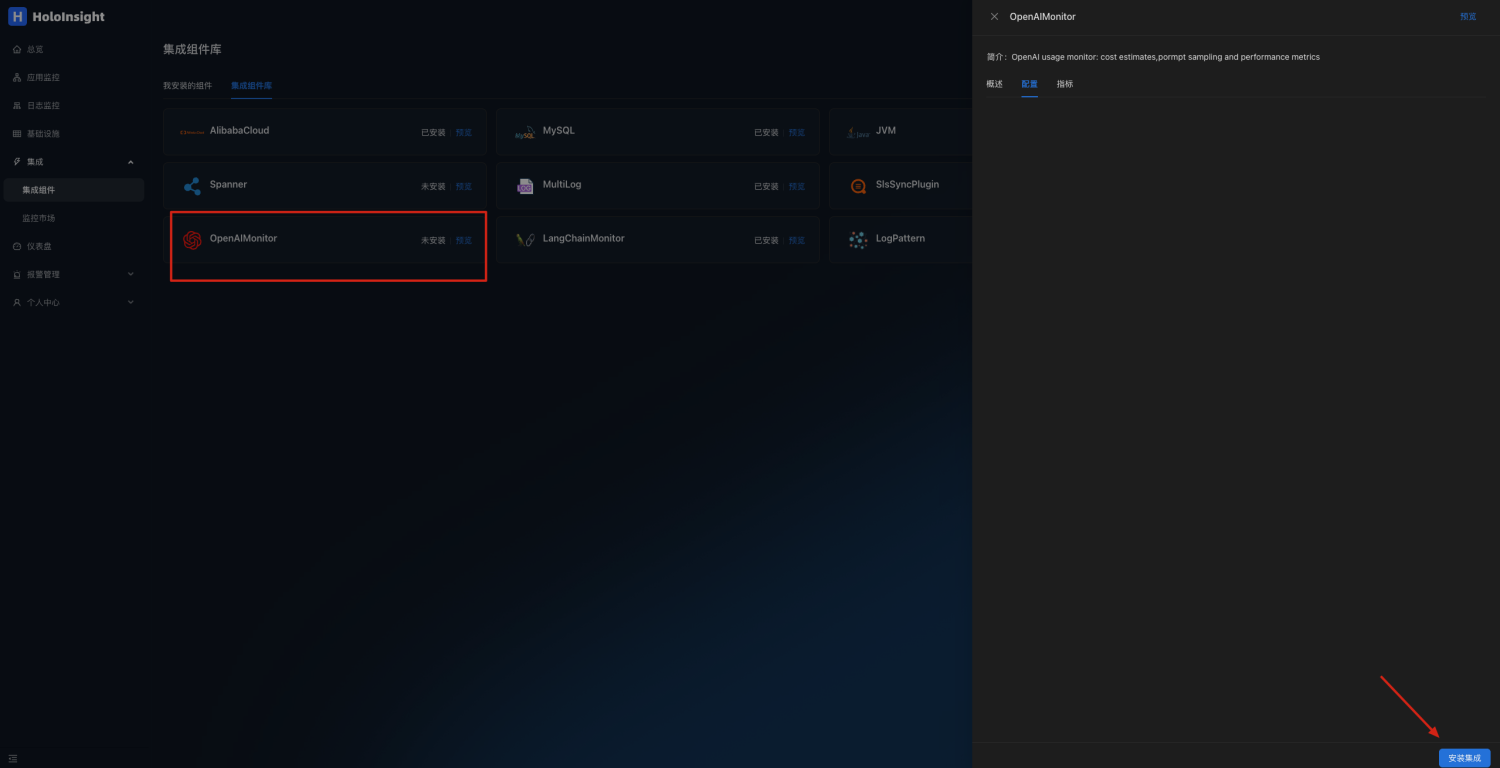 Click to preview
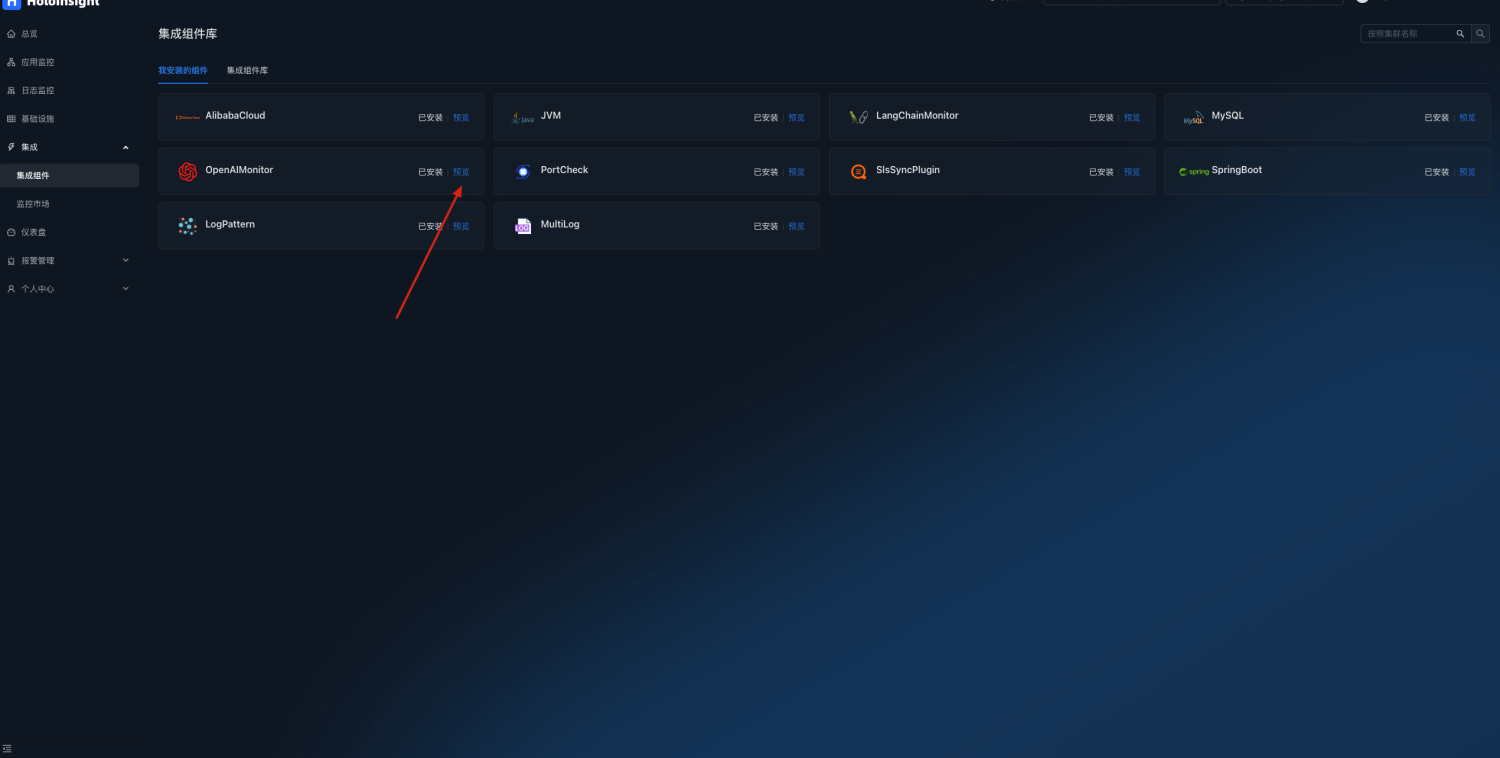
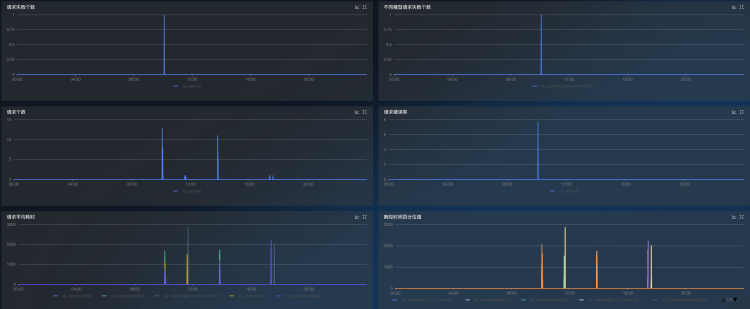
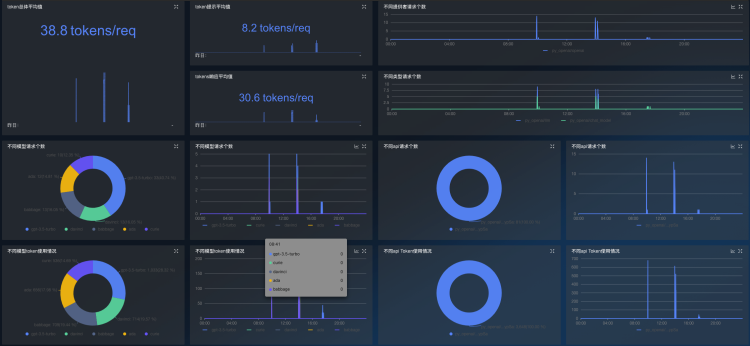
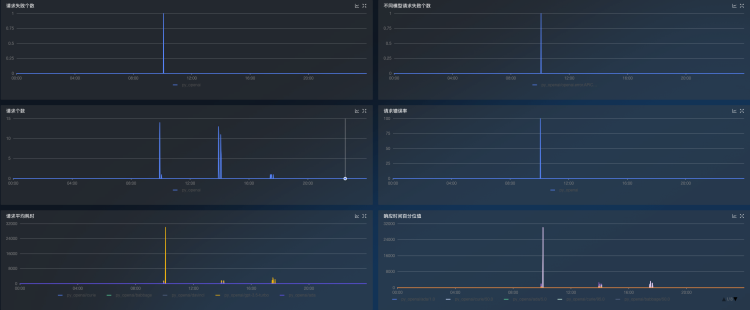
OpenAI monitoring dashboards can be automatically generated to monitor token usage and interface requests
LangChainMonitor plugin
Configure environment variables in the environment of your service
export DD_SERVICE="your_app_name"
Import ddtrace package in the LangChain code
pip install ddtrace>=1.17
Below is a code sample that you can run directly to test
import os
from langchain import OpenAI
from langchain.chat_models import ChatOpenAI
from flask import Flask
from ddtrace import tracer, patch

app = Flask(__name__)
tag = {
    'env': 'test',
    'tenant': 'default', # Configuring tenant information
    'version': 'v0.1'
}
# Set the Collector_DataDog address and port
tracer.configure(
    hostname="localhost",
    port="5001"
)
tracer.set_tags(tag)
patch(langchain=True)

os.environ["OPENAI_API_KEY"] = "sk-***********" # Enter the openai api_key
os.environ["OPENAI_PROXY"] = "******"           # Configure proxy addresses as required

@app.route('/test/langchain')
def hello_world():
    return ChatFuc('gpt-3.5-turbo')

def OpenAIFuc(model):
    random_string = 'Hello World!'
    chat = OpenAI(temperature=0, model_name=model, max_tokens=50)
    return chat.predict(random_string)

def ChatFuc(model):
    random_string = 'Hello World!'
    chat = ChatOpenAI(temperature=0, model_name=model)
    return chat.predict(random_string)


if __name__ == '__main__':
    app.run(port=5003)
Calling interface
curl --location --request GET 'localhost:5003/test/langchain'
Open page http://localhost:8080/integration/agentComp?tenant=default.
Install the LangChainMonitor plug-in on the Integration Components page
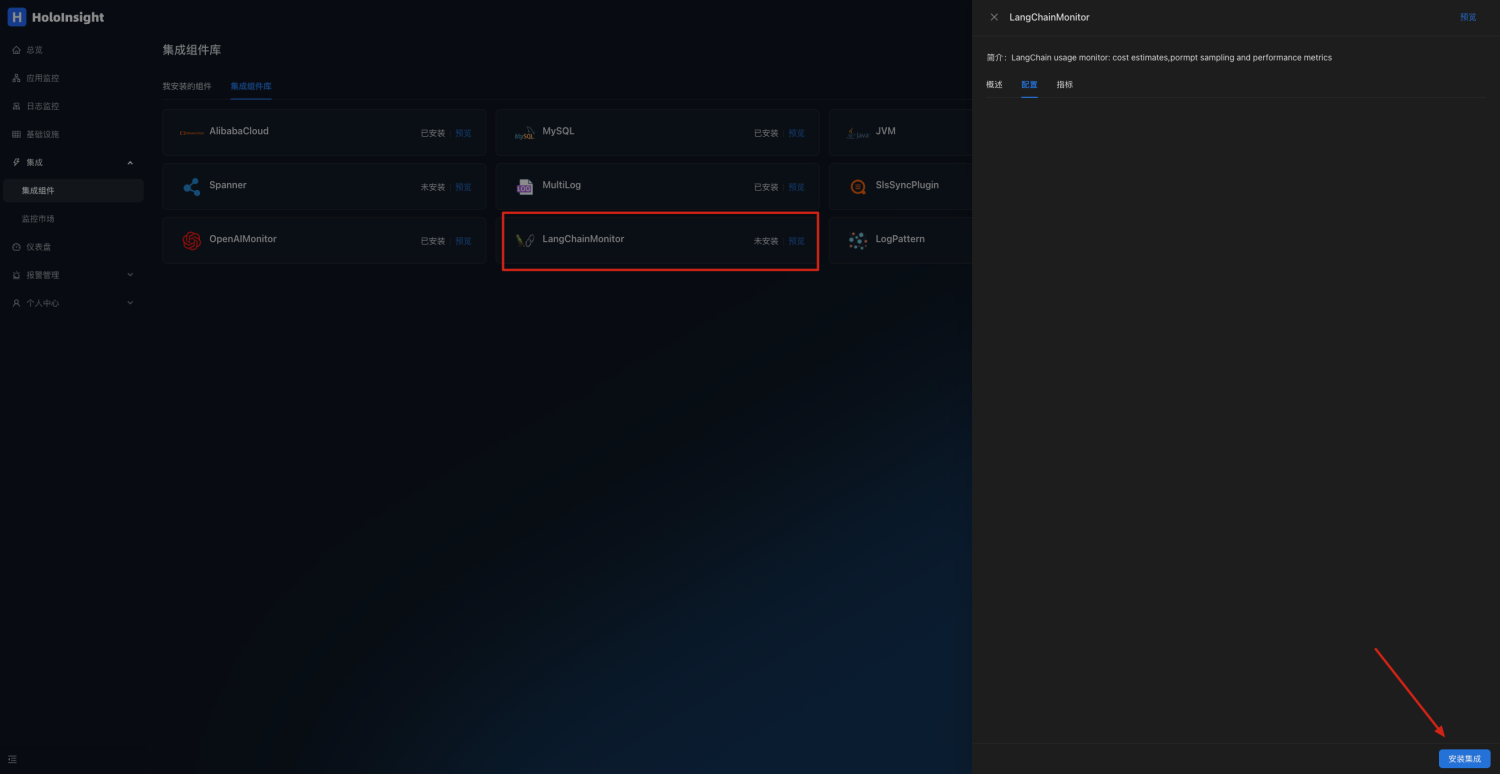 Click to preview
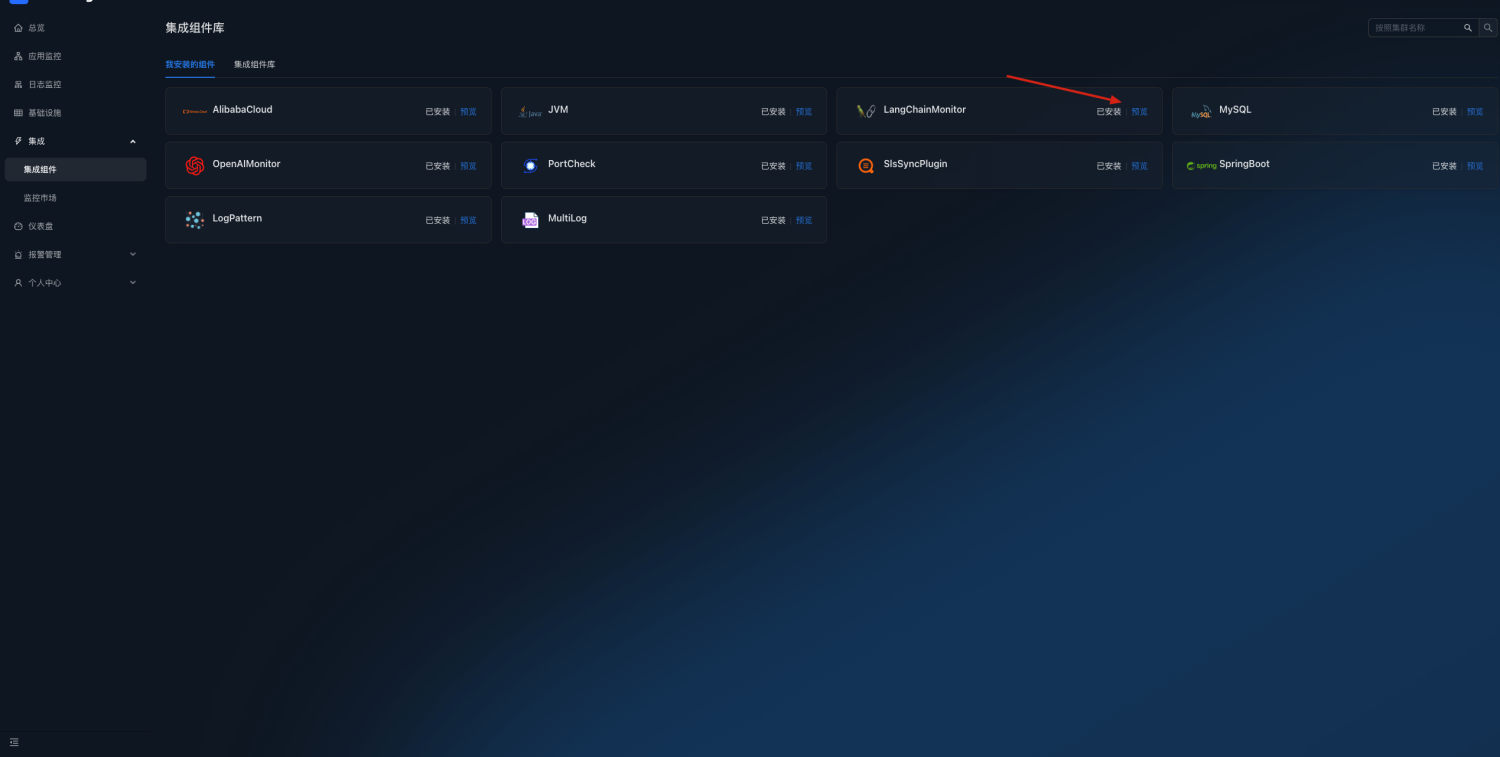
LangChain monitoring dashboards can be automatically generated to monitor token usage and interface requests
dcgmMonitor 插件
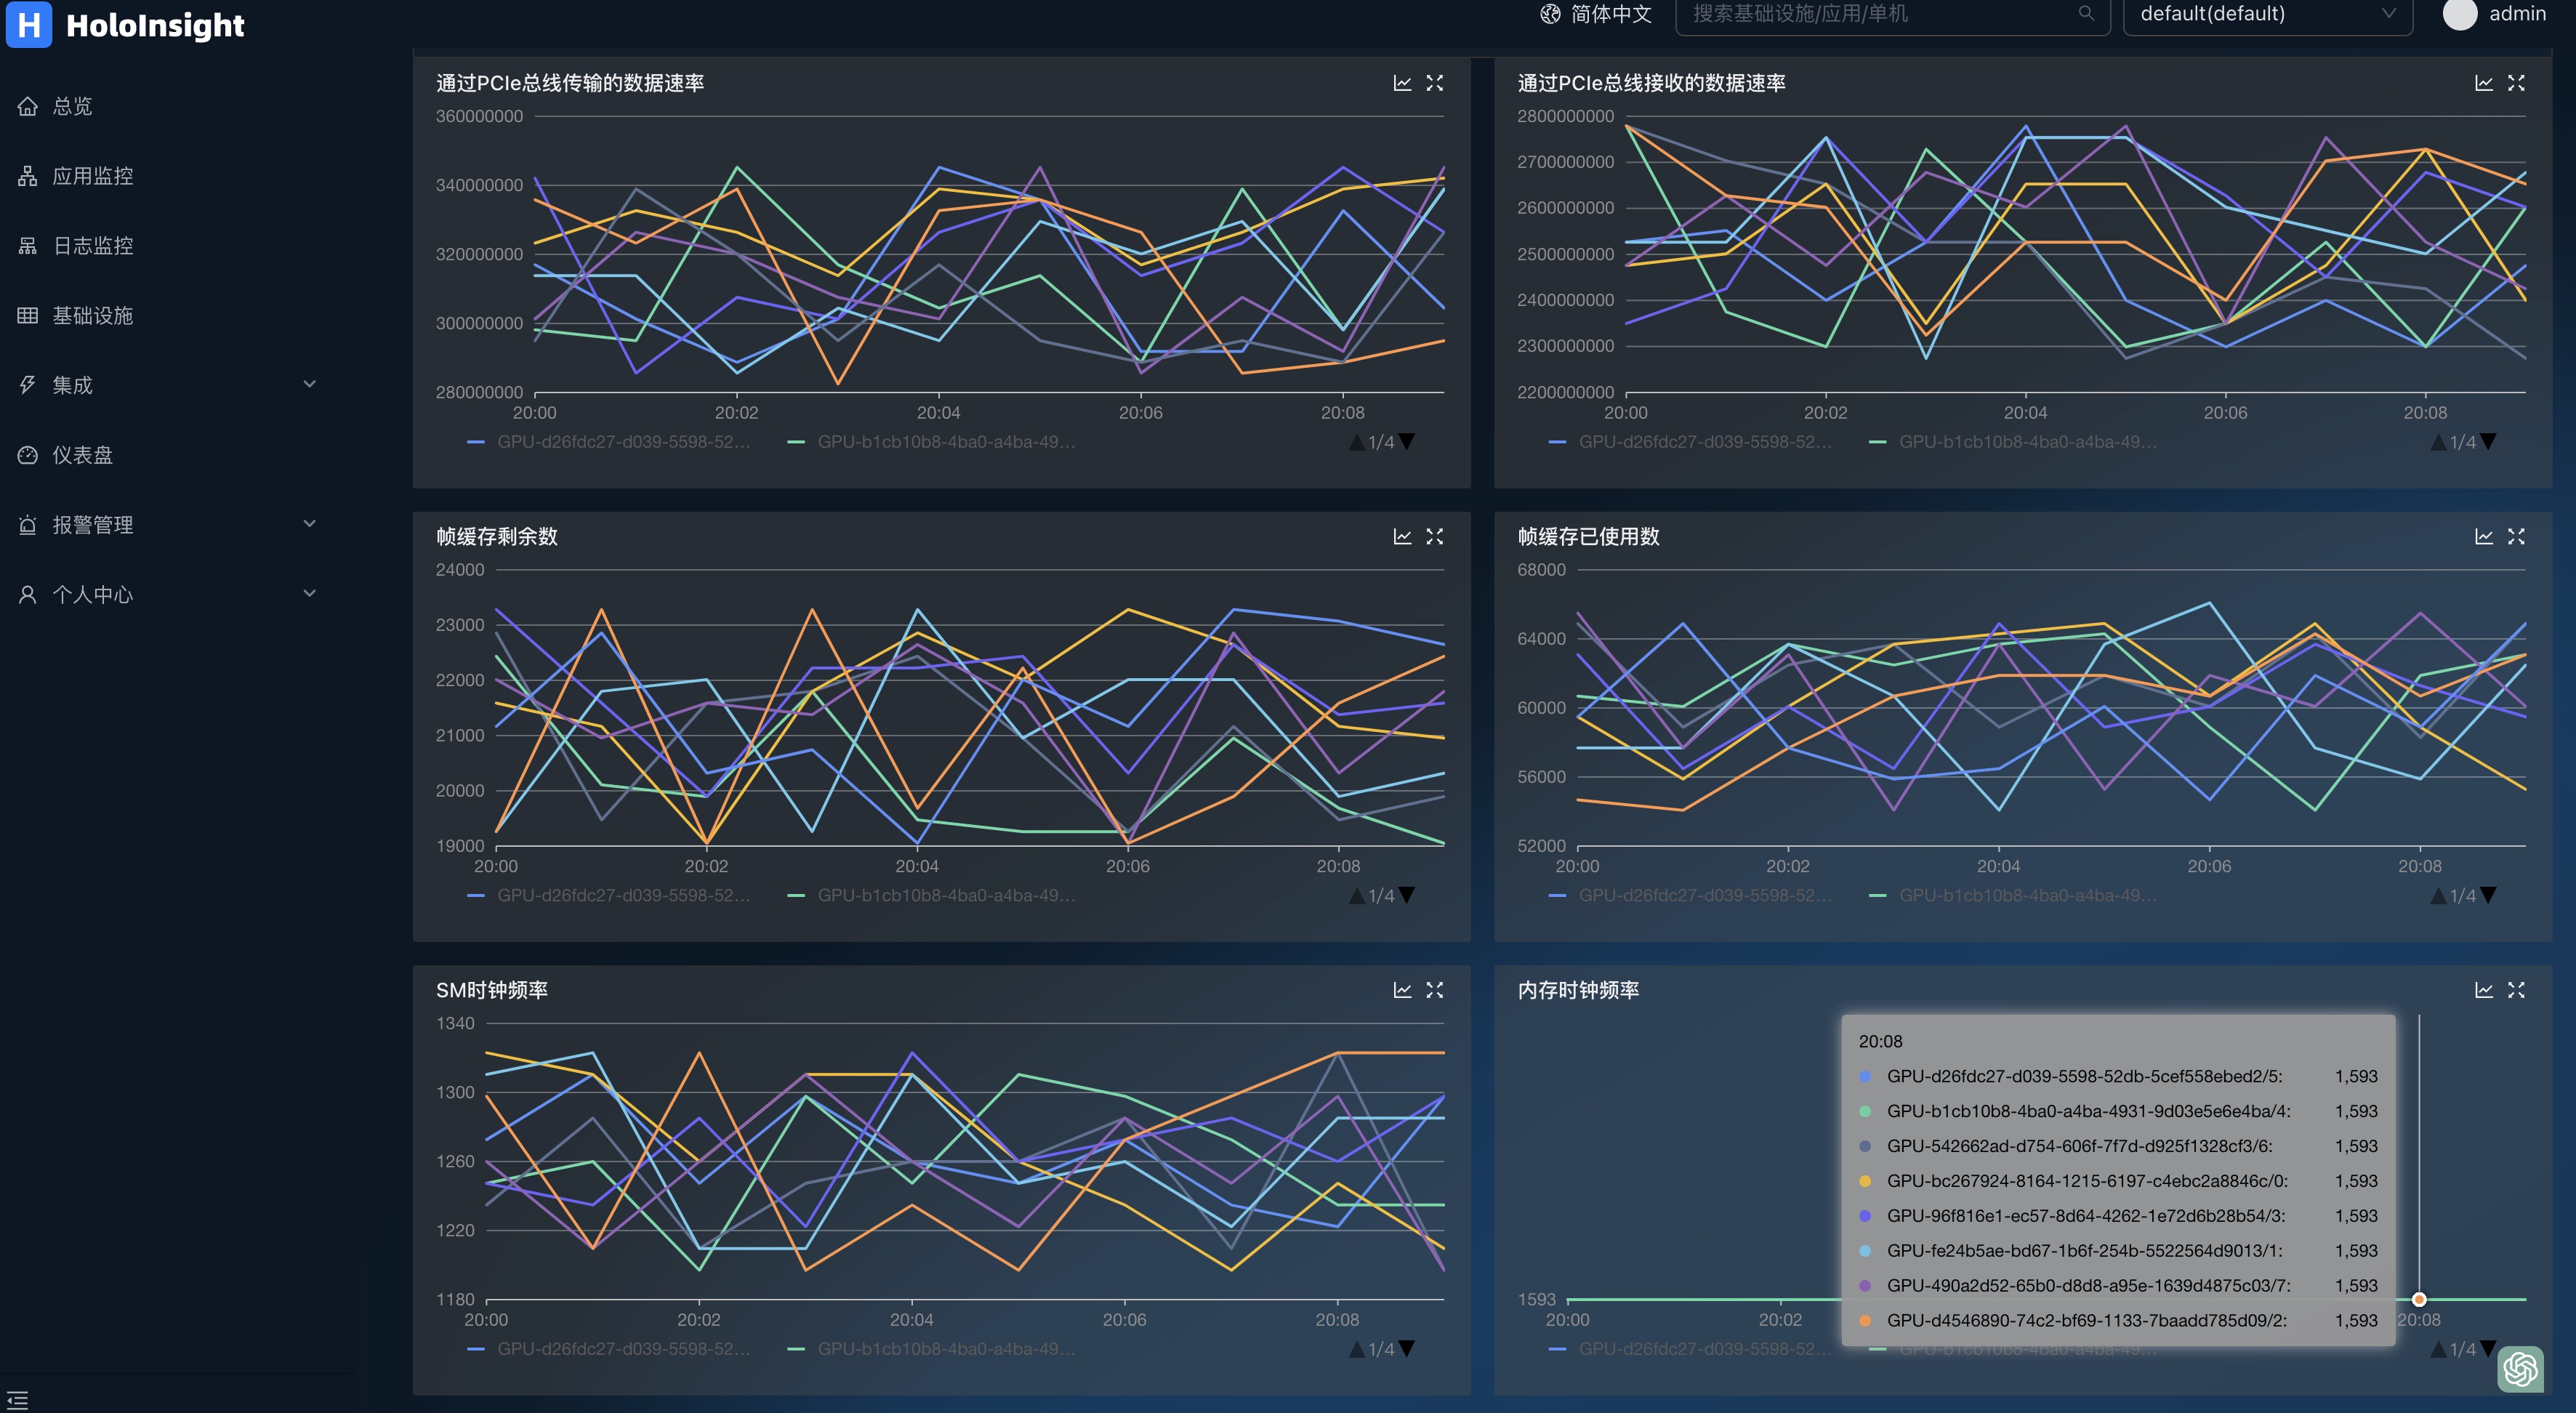
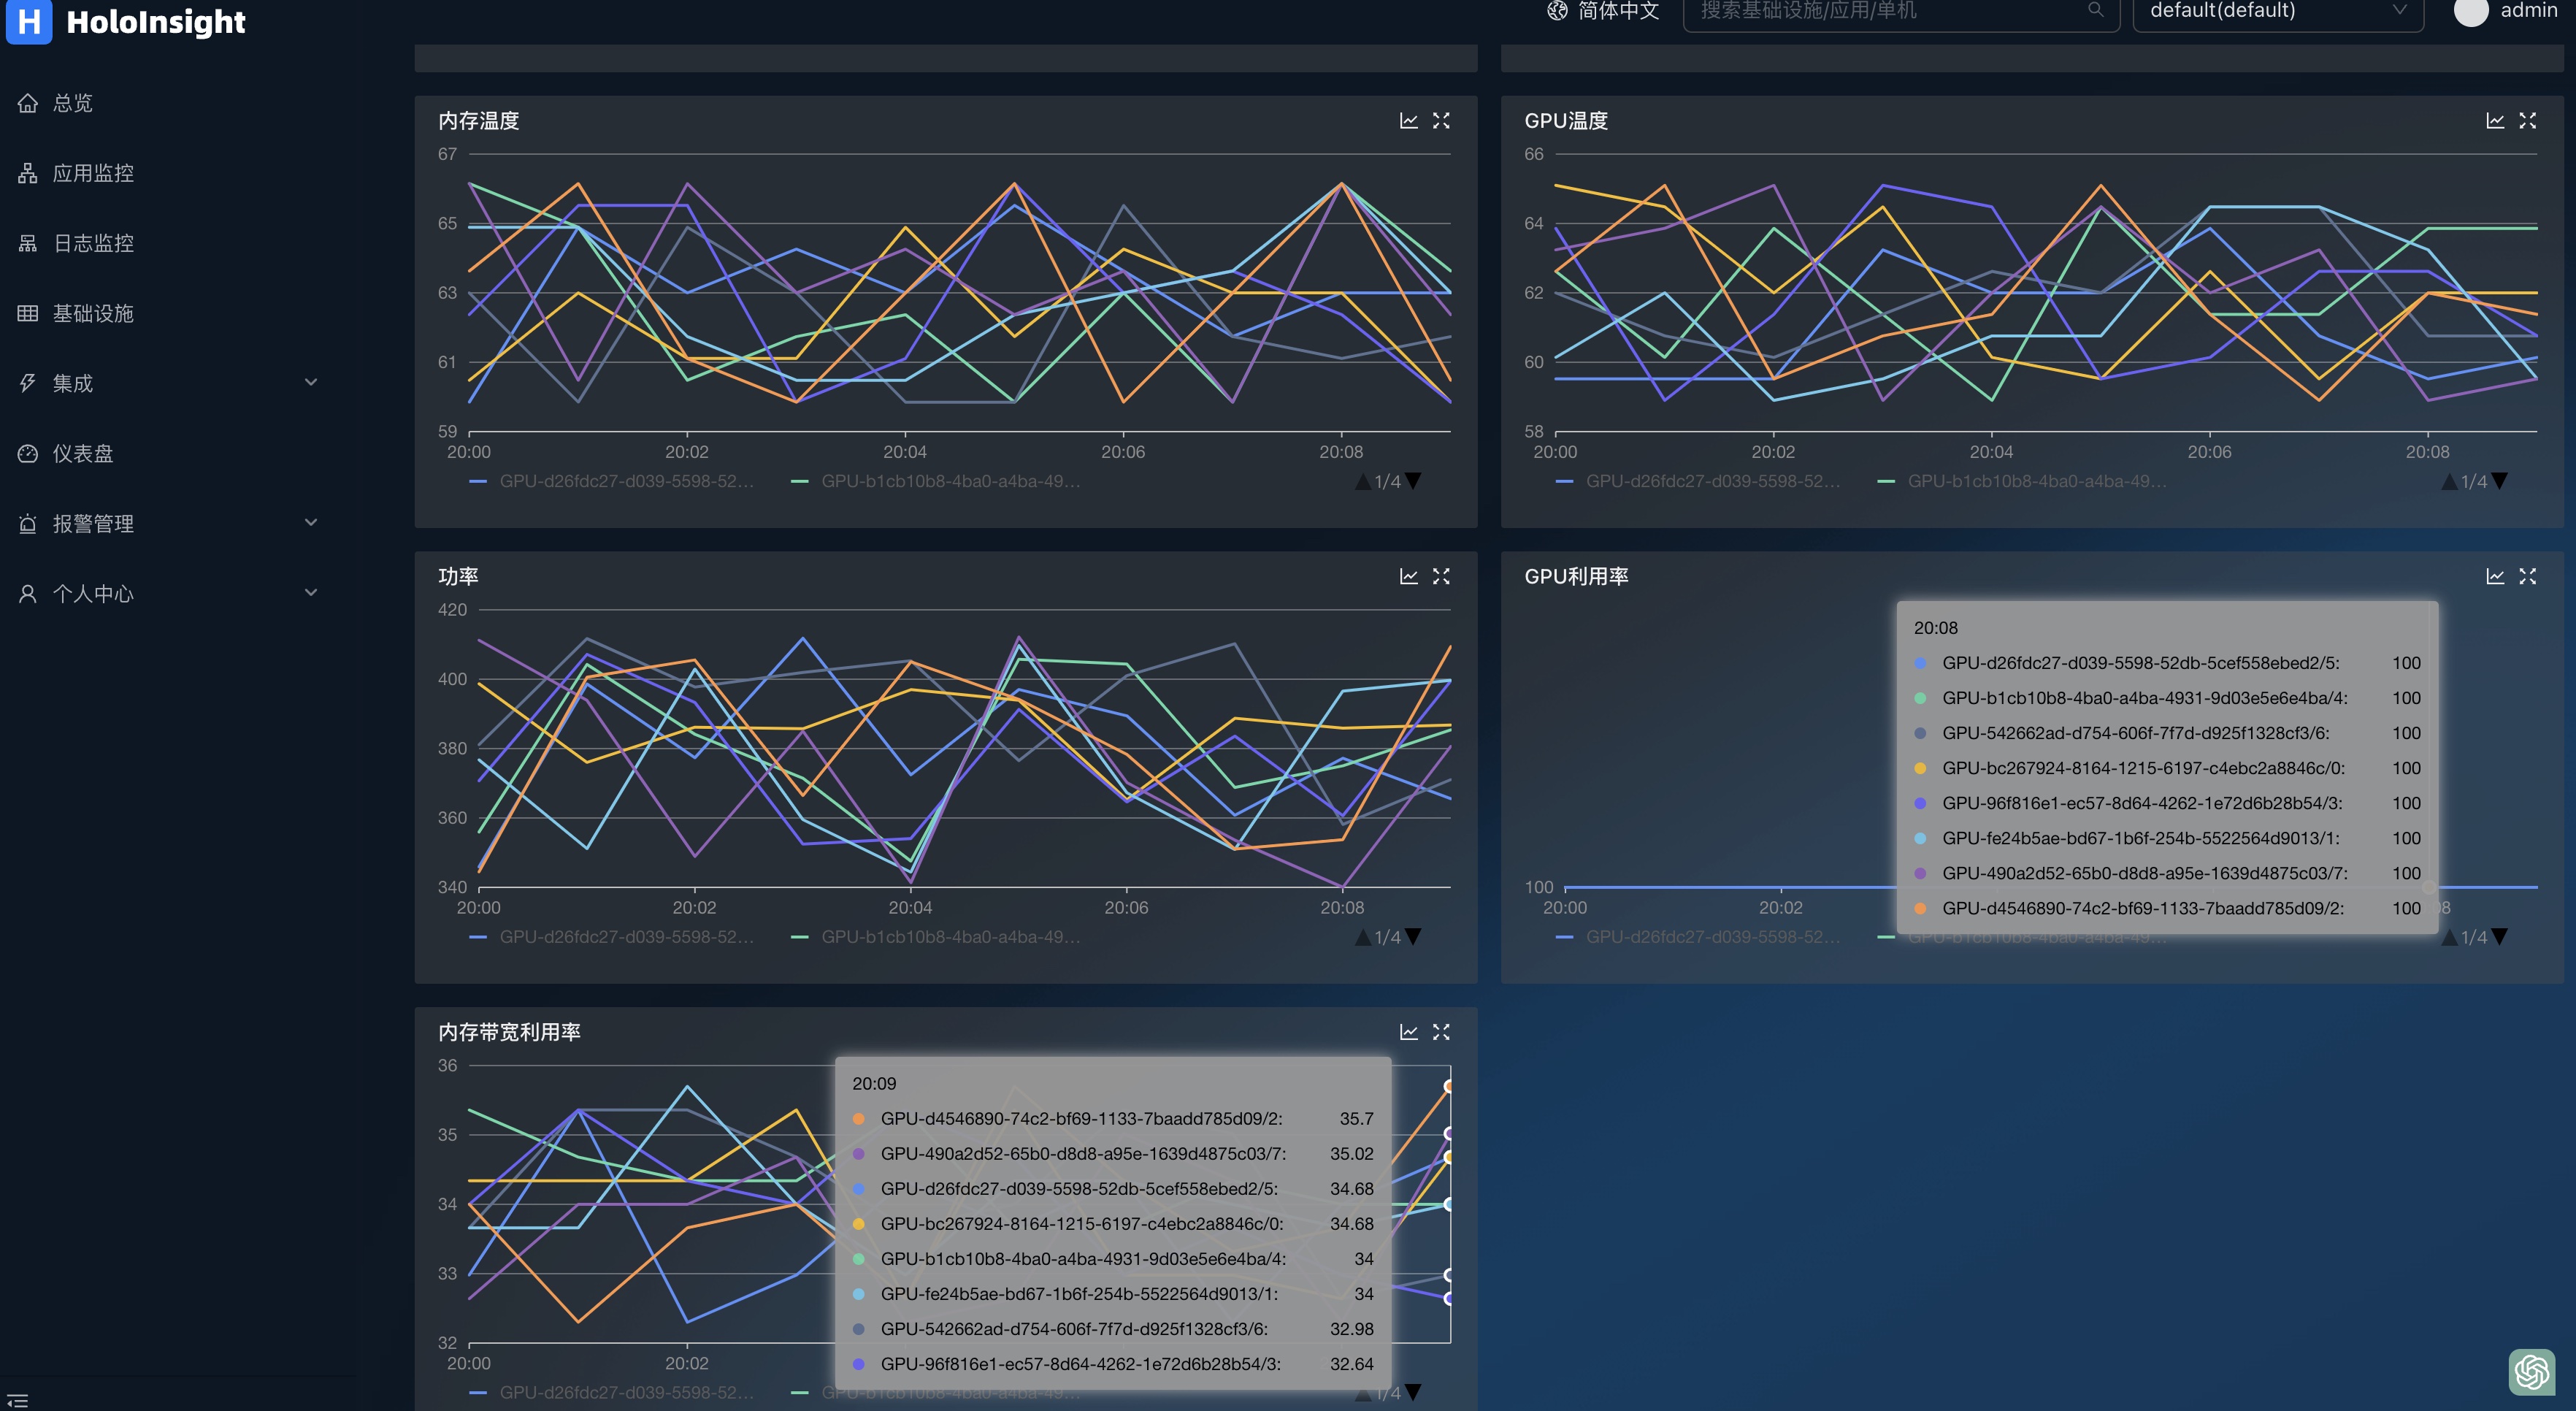
Deploy the k8s environment on your GPU machine, and install dcgm-exporter and Holoinsigh-Agent, as described in the documentation
By default, GPU data is collected after installation
Open page http://localhost:8080/integration/agentComp?tenant=default.
Install the DCGMMonitor plug-in on the Integration Components page
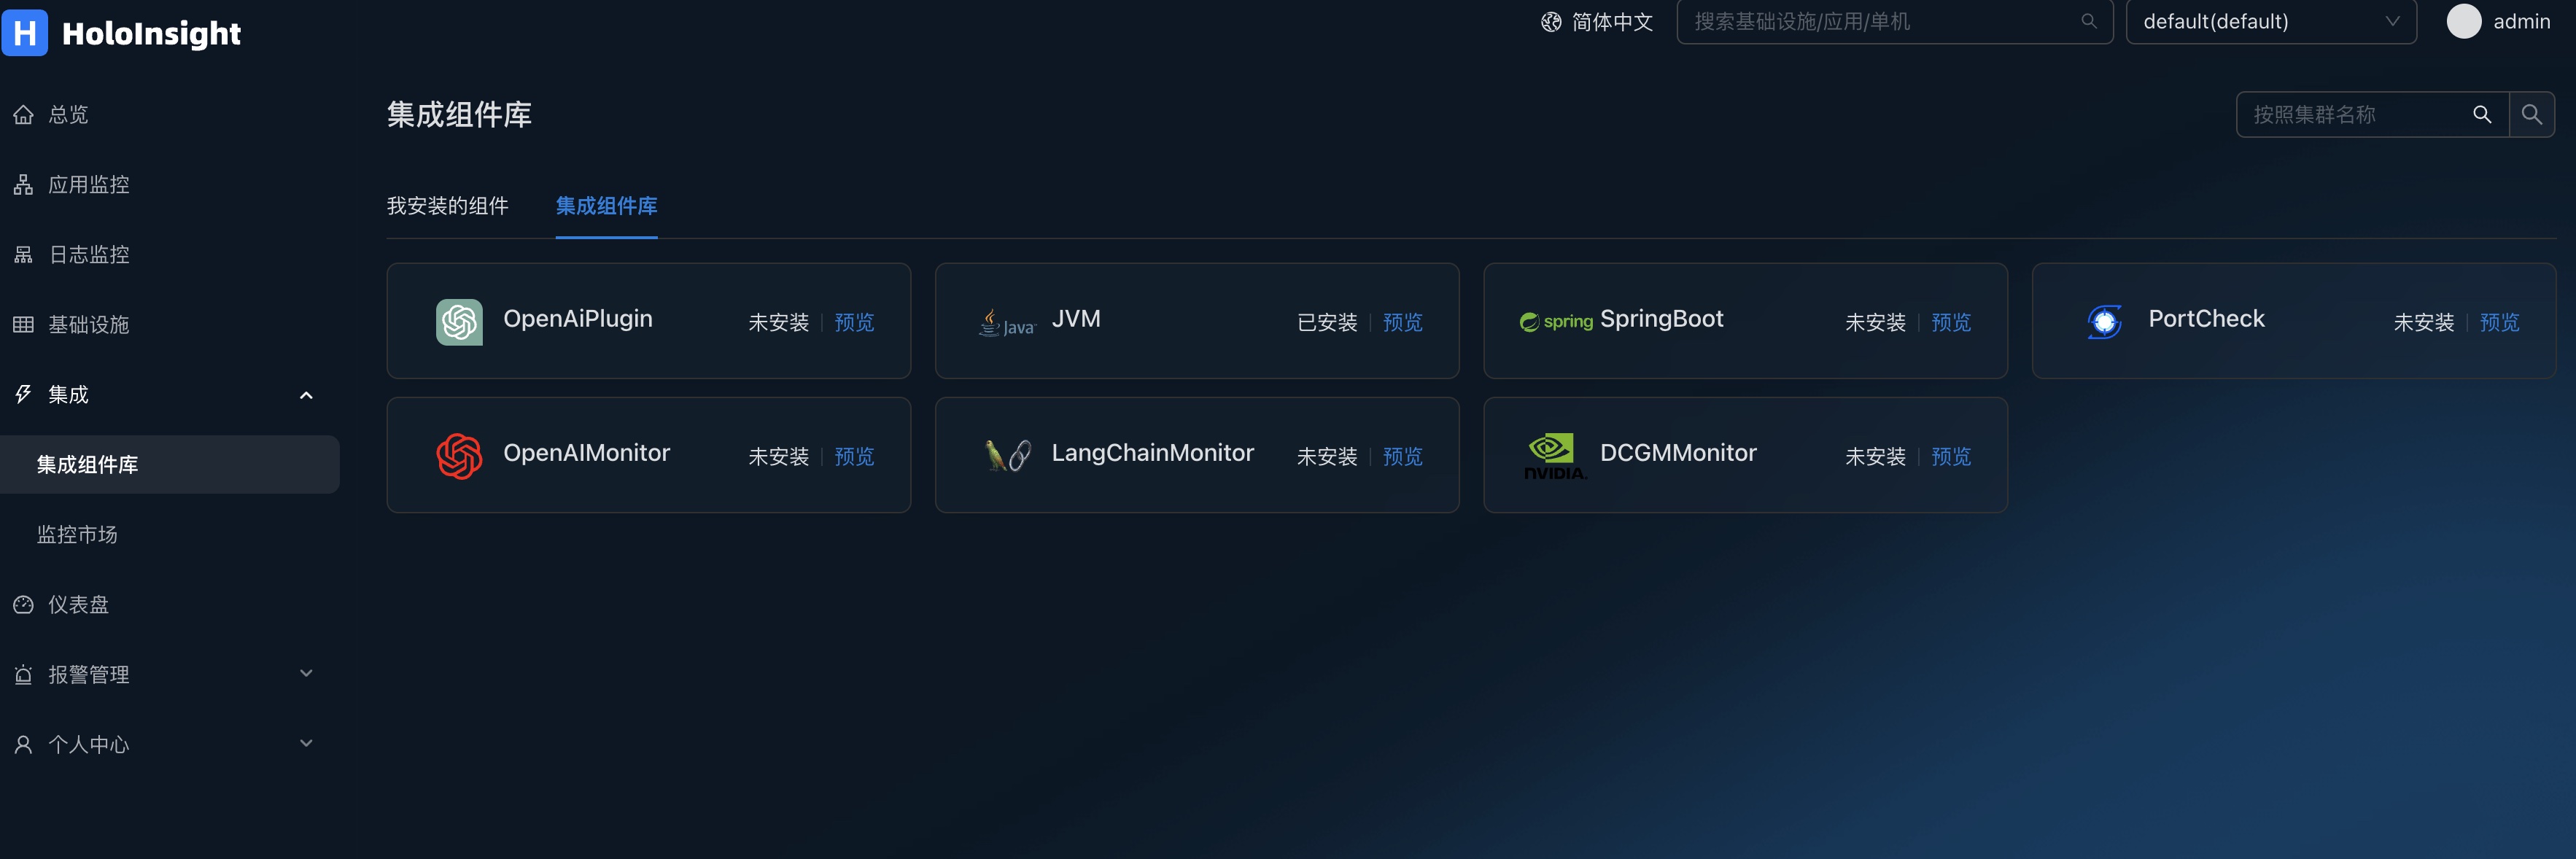 Click to preview
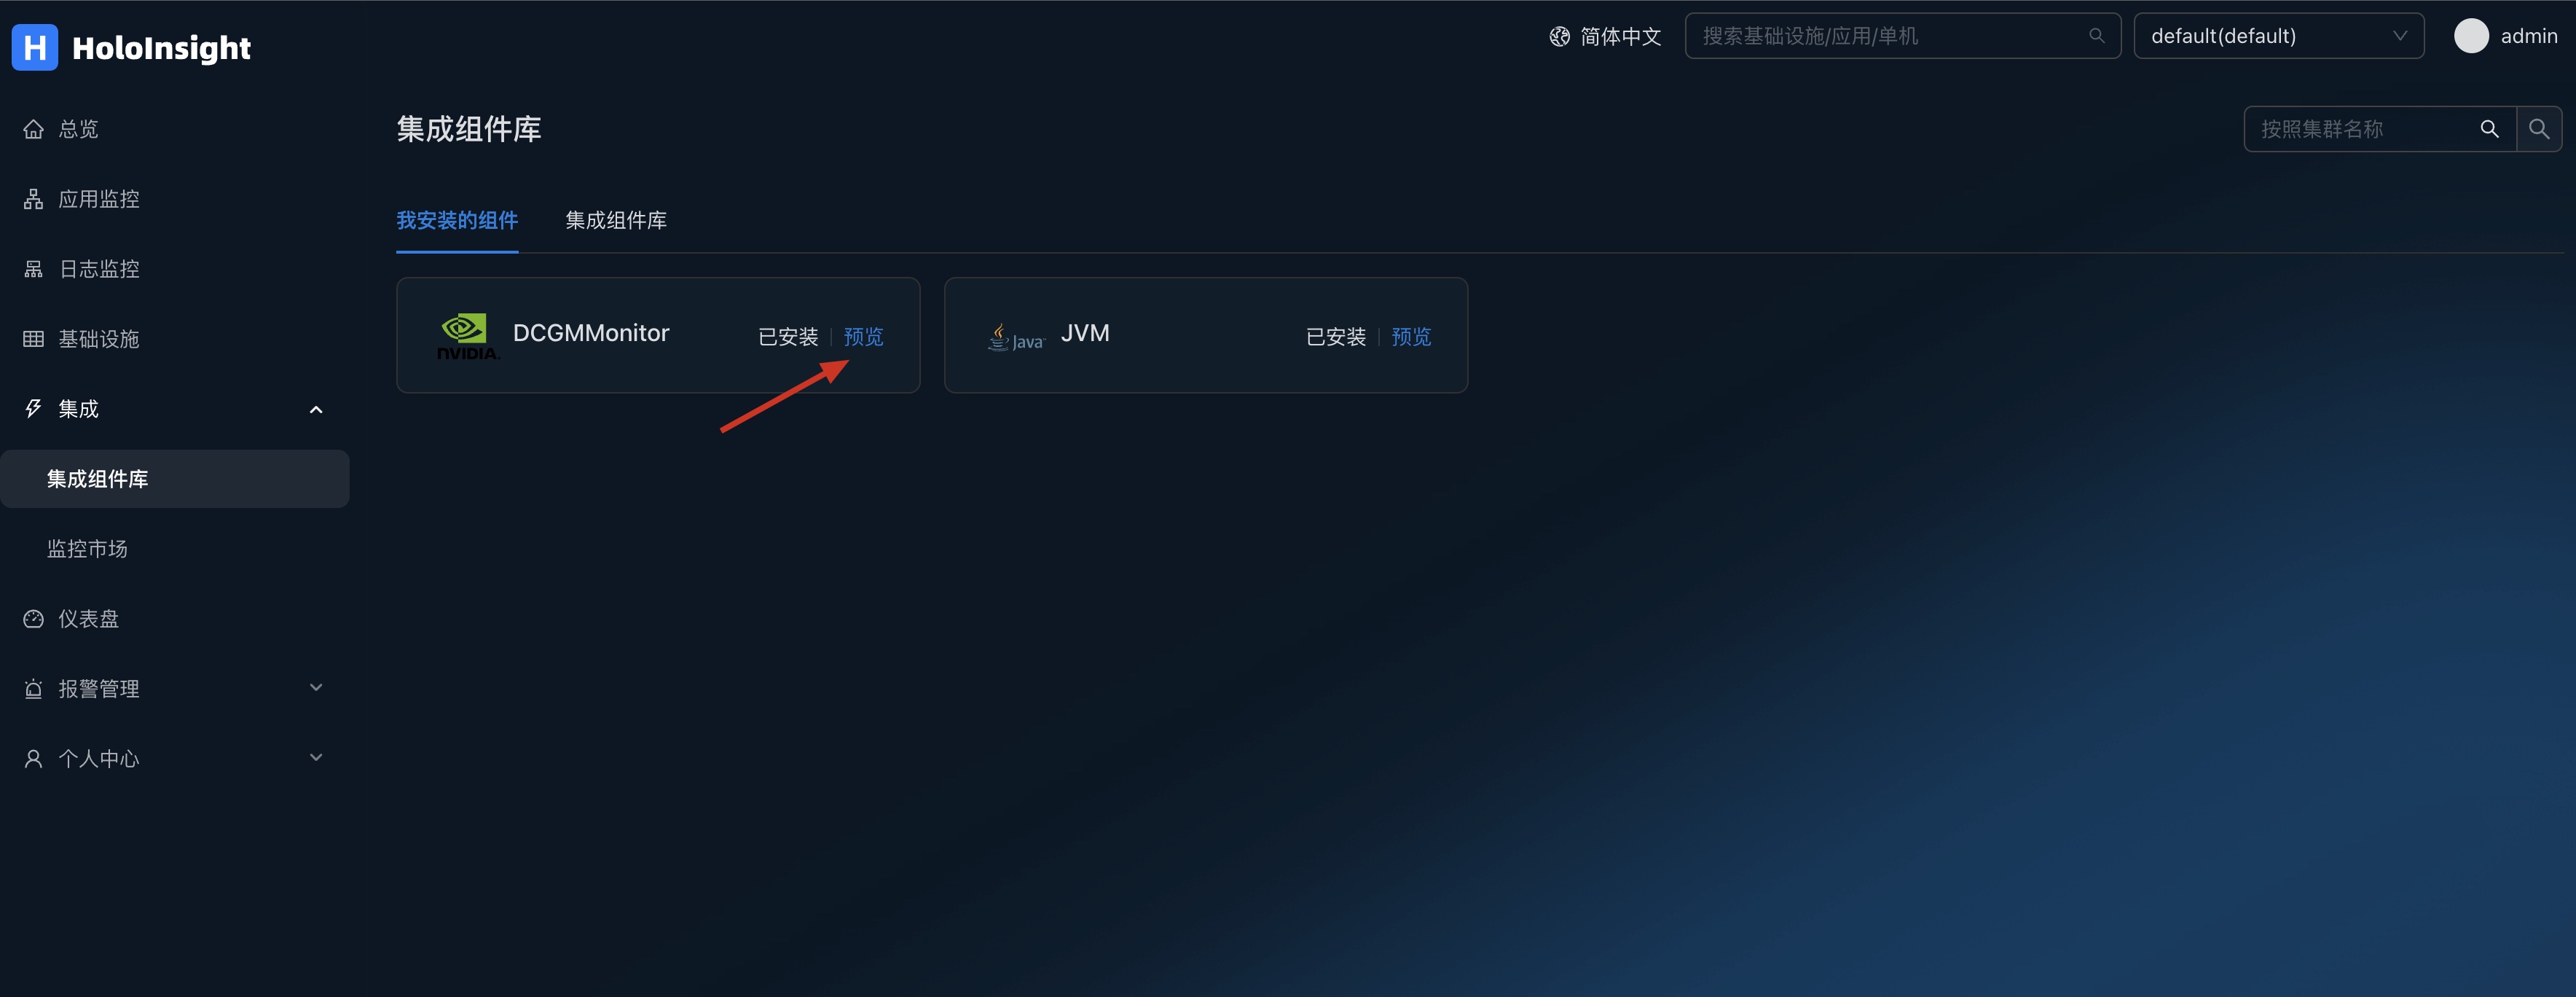
DCGMMonitor dashboards can be automatically generated to monitor GPU information
Server project structure
- deploy/
- examples/
- docker-compose/ -> docker-compose based deployment example
- k8s/ -> k8s based deployment example
- examples/
- scripts/
- all-in-one/ -> 'all-in-one' related scripts
- api/ -> Debug Api scripts
- docker/ -> Build docker image
- add-license.sh -> Add license header to Java source codes
- check-format.sh -> Check if Java source codes are well formatted
- check-license.sh -> Check if Java source codes has license header
- format.sh -> Format Java codes
- test/
- e2e/
- all.sh -> Run all E2E tests
- e2e/
- server/
- all-in-one/ -> This 'all-in-one' module references all other modules, so that all modules can be run by a Java program
- apm/
- common/ -> including some tools/auxiliary classes
- extension/
- gateway/ -> Data entrance gateway module
- holoinsight-dependencies/ -> A maven module for dependencies management
- home/ -> Home module provides webapis which front-end uses
- meta/ -> Meta module manages meta of k8s nodes/pods
- query/ -> Query module provides grpc api for other modules to query monitoring data
- registry/ -> Registry module maintains connections between Agents, delivers 'monitoring data collection task' to Agents.
- server-parent/ -> A maven parent for other modules
- test/
- scenes/ test scenes directory
- scene-default/ a test scene named
scene-default- docker-compose.yaml
- up.sh -> deploy this scene using docker-compose
- down.sh -> tear down this scene
- scene-default/ a test scene named
- scenes/ test scenes directory
- .pre-commit-config.yaml -> pre-commit config
- Formatter.xml -> Google Code Style
- HEADER -> License Header
- LICENSE -> License
- README.md
- README-CN.md
Dev requirements
- The format and license header of codes must be well checked before merge to
mainbranch. We have use aGithub Actionto ensure this rule. - It is recommended to use
pre-commithook or run./scripts/format.sh && ./scripts/add-license.shmanually before daily submitting. - All important classes and methods(e.g. abstract method) of newly submitted codes must have complete comments. The reviewer can refuse to pass the PR until sufficient comments are added.
Conventional Commit Guide
This document describes how we use conventional commit in our development.
Structure
We would like to structure our commit message like this:
<type>[optional scope]: <description>
There are three parts. type is used to classify which kind of work this commit does. scope is an optional field that provides additional contextual information. And the last field is your description of this commit.
Type
Here we list some common types and their meanings.
feat: Implement a new feature.fix: Patch a bug.docs: Add document or comment.build: Change the build script or configuration.style: Style change (only). No logic involved.refactor: Refactor an existing module for performance, structure, or other reasons.test: Enhance test coverage or harness.chore: None of the above.
Scope
The scope is more flexible than type. And it may have different values under different types.
For example, In a feat or build commit we may use the code module to define scope, like
feat(cluster):
feat(server):

build(ci):
build(image):
And in docs or refactor commits the motivation is prefer to label the scope, like
docs(comment):
docs(post):

refactor(perf):
refactor(usability):
But you don't need to add a scope every time. This isn't mandatory. It's just a way to help describe the commit.
After all
There are many other rules or scenarios in conventional commit's website. We are still exploring a better and more friendly workflow. Please do let us know by open an issue if you have any suggestions ❤️
Database table structures
We use flyway to manage our database table structures. When deploying HoloInsight to a new environment, flyway helps to create all tables for us. When we make a database structures change in dev environment, and upgrade existing HoloInsight in an existing prod environment, flyway helps to upgrade the database structures too.
When you want to make a database structure change, you need to add the DDLs as a file under the directory ./server/extension/extension-common-flyway/src/main/resources/db/migration.
The sql file name must match the format: V${n}__${date}_${comment}.sql .
For example: V3__230321_AlarmRule_COLUMN_workspace.sql.
Once the sql file is officially released, it cannot be modified or deleted.
If you find some errors in the previous sql file, then you need to add another sql file to fix it.
Compile Server
Compile requirements:
- JDK 8
- Maven
sh ./scripts/all-in-one/build.sh
compile result:
- server/all-in-one/target/holoinsight-server.jar : A Spring Boot fat jar
Compile Agent
Compile requirements:
- Golang 1.19 or docker
Compile using go:
./scripts/build/build-using-go.sh
Compile using docker:
./scripts/build/build-using-docker.sh
compile result:
- build/linux-amd64/bin/agent
- build/linux-amd64/bin/helper
Build server docker image
Build requirements:
- Linux or Mac
- JDK 8
- Maven
- Docker
- Docker buildx
Build server-base docker image for multi arch
./scripts/docker/base/build.sh
build result:
- holoinsight/server-base:$tag
The image will be pushed to Docker Hub.
Build server docker image for current arch
./scripts/docker/build.sh
build result:
- holoinsight/server:latest
The image will only be loaded into local Docker.
Build server docker image for multi arch
./scripts/docker/buildx.sh
build result:
- holoinsight/server:latest
The image will be pushed to Docker Hub.
Build agent docker image
Build requirements:
- Linux or Mac
- Docker
- Docker buildx
Build agent-builder docker image
holoinsight/agent-builder Docker image containing golang env for agent can be used to build agent binaries.
./scripts/build/agent-builder/build.sh
build result:
- holoinsight/agent-builder:$tag
The image will be pushed to Docker Hub.
Build agent-base docker image
holoinsight/agent-base
./scripts/docker/agent-base/build.sh
build result:
- holoinsight/agent-base:$tag
The image will be pushed to Docker Hub.
Build agent docker image for current arch
./scripts/docker/build.sh

# Users in China can use GOPROXY to speed up building
GOPROXY="https://goproxy.cn,direct" ./scripts/docker/build.sh
build result:
- holoinsight/agent:latest (contains only current arch)
The image will only be loaded into local Docker.
Build multi arch docker image
./scripts/docker/buildx.sh

# Users in China can use GOPROXY to speed up building
GOPROXY="https://goproxy.cn,direct" ./scripts/docker/buildx.sh
build result:
- holoinsight/agent:latest (contains linux/amd64 and linux/arm64/v8 platforms)
The image will be pushed to Docker Hub.
Notice
Some build scripts require the permission to push images to Docker Hub.
These scripts can only be executed by core developers of HoloInsight.
Docker image details
Firstly check the Dockerfile the server uses.
Here are some details of Dockerfile:
- Install azul openjdk at /opt/java8
- Use Supervisord to control our Java and Nginx processes.
- Java/Nginx worker processes run as user 'admin'
- The app fat jar location is /home/admin/app.jar
- The log location is
/home/admin/logs/holoinsight-server/ - The front-end resources location is
/home/admin/holoinsight-server-static/ alias g="cd /home/admin/logs/holoinsight-server/"- The helper scripts location is
/home/admin/logs/api/which is a soft link to/home/admin/api/. Considering that most of the time We will be in the/home/admin/logs/holoinsight-server/directory (using command 'g'), We put the api directory here and use syntaxsh ../api/basic/versionrefers to them - Alias sc to
supervisorctl(check/usr/local/bin/sc). So usescorsc statusto check app running status, usesc start/stop/restart appto control the app process. There are some helper scripts based onscin/home/admin/bin/.
Run server
The result of compile is a Spring Boot fat jat holoinsight-server.jar.
java -jar holoinsight-server.jar
Next:
Deployment for testing
This method is for quick local verification and is not suitable for production-level deployment.
Requirements:
- JDK8
- Maven
- Docker
- Docker compose v1.29.2
Now there is a test scene named scene-default. More test scenes will be added in the future.
Every scene has a docker-compose.yaml and some other resource files.
You can manually deploy a test scene using the following scripts:
# Deploy HoloInsight using docker-compose without building image from code
./test/scenes/${scene_name}/up.sh

# Build image from code, and then deploy HoloInsight using docker-compose
# debug=1 means enable Java remote debugger
build=1 debug=1 ./test/scenes/${scene_name}/up.sh

# Tear down HoloInsight
./test/scenes/${scene_name}/down.sh
For example:
#./test/scenes/scene-default/up.sh
Removing network scene-default_default
WARNING: Network scene-default_default not found.
Creating network "scene-default_default" with the default driver
Creating scene-default_agent-image_1 ... done
Creating scene-default_ceresdb_1     ... done
Creating scene-default_mysql_1       ... done
Creating scene-default_mongo_1       ... done
Creating scene-default_prometheus_1  ... done
Creating scene-default_mysql-data-init_1 ... done
Creating scene-default_server_1          ... done
Creating scene-default_finish_1          ... done

[agent] install agent to server
copy log-generator.py to scene-default_server_1
copy log-alert-generator.py to scene-default_server_1

             Name                            Command                  State                                        Ports
---------------------------------------------------------------------------------------------------------------------------------------------------------
scene-default_agent-image_1       true                             Exit 0
scene-default_ceresdb_1           /tini -- /entrypoint.sh          Up (healthy)   0.0.0.0:50171->5440/tcp, 0.0.0.0:50170->8831/tcp
scene-default_finish_1            true                             Exit 0
scene-default_mongo_1             docker-entrypoint.sh mongod      Up (healthy)   0.0.0.0:50168->27017/tcp
scene-default_mysql-data-init_1   /init-db.sh                      Exit 0
scene-default_mysql_1             docker-entrypoint.sh mysqld      Up (healthy)   0.0.0.0:50169->3306/tcp, 33060/tcp
scene-default_prometheus_1        /bin/prometheus --config.f ...   Up             0.0.0.0:50172->9090/tcp
scene-default_server_1            /entrypoint.sh                   Up (healthy)   0.0.0.0:50175->80/tcp, 0.0.0.0:50174->8000/tcp, 0.0.0.0:50173->8080/tcp

Visit server at http://192.168.3.2:50175
Debug server at 192.168.3.2:50174 (if debug mode is enabled)
Exec server using ./server-exec.sh

Visit mysql at 192.168.3.2:50169
Exec mysql using ./mysql-exec.sh
#./test/scenes/scene-default/down.sh
Stopping scene-default_server_1     ... done
Stopping scene-default_prometheus_1 ... done
Stopping scene-default_mysql_1      ... done
Stopping scene-default_mongo_1      ... done
Stopping scene-default_ceresdb_1    ... done
Removing scene-default_finish_1          ... done
Removing scene-default_server_1          ... done
Removing scene-default_mysql-data-init_1 ... done
Removing scene-default_prometheus_1      ... done
Removing scene-default_mysql_1           ... done
Removing scene-default_mongo_1           ... done
Removing scene-default_ceresdb_1         ... done
Removing scene-default_agent-image_1     ... done
Removing network scene-default_default
Name isolation
When running scripts under ./test/scenes/${scene_name}/ such up.sh, you can configure an environment variable named HOLOINSIGHT_DEV to isolate image names and container names.
For example:
Add export HOLOINSIGHT_DEV=YOUR_PREFIX to your ~/.bashrc.
And run:
build=1 ./test/scene/scene-default/up.sh
The names of the built images and running containers will be prefixed with "dev-YOUR_PREFIX".
Server bootstrap configuration
The server is a Spring Boot app. It manages bootstrap parameters using config/application.yaml.
Check Externalized Configuration in Spring Boot document.
You can use all the methods mentioned in the Spring Boot document to modify the configuration.
Here is a simple application.yaml with notes.
spring:
  application:
    name: holoinsight
  datasource:
    url: jdbc:mysql://127.0.0.1:3306/holoinsight?useUnicode=true&characterEncoding=UTF-8&autoReconnect=true&rewriteBatchedStatements=true&socketTimeout=15000&connectTimeout=3000&useTimezone=true&serverTimezone=Asia/Shanghai
    username: holoinsight
    password: holoinsight
    driver-class-name: com.mysql.cj.jdbc.Driver
  data:
    mongodb:
      # We use mongodb as metadata storage
      uri: mongodb://holoinsight:holoinsight@127.0.0.1:27017/holoinsight?keepAlive=true&maxIdleTimeMS=1500000&maxWaitTime=120000&connectTimeout=10000&socketTimeout=10000&socketKeepAlive=true&retryWrites=true
  jackson:
    # This project was first written by Chinese people, so here are some hard codes It will be removed later
    time-zone: Asia/Shanghai
    date-format: yyyy-MM-dd HH:mm:ss

mybatis-plus:
  config-location: classpath:mybatis/mybatis-config.xml
  mapper-locations:
  - classpath*:sqlmap/*.xml
  - classpath*:sqlmap-ext/*.xml

server:
  compression:
    enabled: true

grpc:
  server:
    port: 9091
  client:
    traceExporterService:
      address: static://127.0.0.1:12801
      negotiationType: PLAINTEXT
    queryService:
      address: static://127.0.0.1:9090
      negotiationType: PLAINTEXT

holoinsight:
  roles:
    # This configuration determines which components are activated
    active: gateway,registry,query,meta,home
  storage:
    elasticsearch:
      enable: true
      hosts: 127.0.0.1
    grpcserver:
      enabled: false
  home:
    domain: http://localhost:8080/
    environment:
      env: dev
      deploymentSite: dev
    role: prod
  alert:
    env: dev
    algorithm:
      url: http://127.0.0.1:5005
  query:
    apm:
      address: http://127.0.0.1:8080
  meta:
    domain: 127.0.0.1
    db_data_mode: mongodb
    mongodb_config:
      key-need-convert: false
  registry:
    meta:
      vip: 127.0.0.1
    domain: 127.0.0.1

management:
  # avoid exposing to public
  server:
    port: 8089
    address: 127.0.0.1
  endpoints:
    web:
      base-path: /internal/api/actuator
      exposure:
        include: prometheus,health
  endpoint:
    health:
      show-details: always

crypto:
  client:
    key: abcdefgh-abcd-abcd-abcd-abcdefghijkl

ceresdb:
  host: foo
  port: 5001
  accessUser: foo
  accessToken: foo
TODO It is necessary to continue to add notes.
Introduction
Dynamic configurations are stored in database, reloaded by server app periodically.
It is suitable for parameters that need to be modified without restarting.
Check Java class AgentConfig
Agent bootstrap configuration
When the agent starts, it will load the initial configuration from $agent_home/agent.yaml.
If $agent_home/agent.yaml does not exist, the configuration will be loaded from $agent_home/conf/agent.yaml.
Some environment variables have higher priority, they can override some configuration items.
Please check: appconfig.go
Agent.yaml example
# Common
apikey: YOUR_API_KEY
workspace: default
cluster: default
registry:
  addr: registry.holoinsight-server
  secure: true
gateway:
  addr: registry.holoinsight-server
  secure: true

version:
basic:
central:

data:
  metric:
    # Only used in k8s/daemonset mode
    refLabels:
      items:
      - key: serviceName
        labels: [ "foo.bar.serviceName1", "foo.bar.serviceName2" ]
        defaultValue: "-"

# Only used in k8s/daemonset mode
k8s:
  meta:
    appRef: ""
    hostnameRef: ""
    nodeHostnameRef: ""
    sidecarCheck: ""
    sandbox:
      labels: { }

# Only used in VM mode
app: "this field is only used in VM mode"
Common
apikey
apikey is required.
apikey: YOUR_API_KEY
workspace
workspace is used to support workspace concept in the product layer. It will be added as a metric tag to separator metrics.
workspace: "default"
If workspace value is empty, "default" will be used.
cluster
cluster is a unique string under same tenant(determined by the apikey). It is used to isolate metadata.
If you have 2 k8s clusters, and you deploy 2 holoinsight-agent daemonset for these 2 clusters respectively with same apikey(so the same tenant).
cluster: ""
If cluster value is empty, "default" will be used.
registry
registry configures the registry address.
gateway:
  addr: registry.holoinsight-server:443
  # Whether to use HTTPS.
  secure: true
If port of addr is empty, 7202 will be used.
gateway
gateway configures the gateway address.
gateway:
  addr: registry.holoinsight-server:443
  # Whether to use HTTPS.
  secure: true
If port of addr is empty, 19610 will be used.
k8s daemonset
k8s:
  meta:
    # appRef defines how to extract app tag from pod meta
    appRef: "label:foo.AppName,label:bar/app-name,env:BAZ_APPNAME"
    # appRef defines how to extract hostname tag from pod meta
    hostnameRef: "label:foo/hostname,env:HOSTNAME"
    nodeHostnameRef: ""
    #  sidecarCheck is used to determine whether a container is a sidecar
    sidecarCheck: "env:IS_SIDECAR:true,name:sidecar"
    sandbox:
      labels: { }

data:
  metric:
    # Ref pod labels as tags
    refLabels:
      items:
      - key: appId
        # Find first not empty label value as appId tag
        labels: [ "foo.bar.baz/app-id", "foo.bar.baz/APPID" ]
        defaultValue: "-"
      - key: envId
        labels: [ "foo.bar.baz/env-id" ]
        defaultValue: "-"
      - key: serviceName
        labels: [ "foo.bar.baz/service-name" ]
        defaultValue: "-"
appRef: "label:foo.AppName,label:bar/app-name,env:BAZ_APPNAME" means extracting the app tag from the following sources, the first non-empty one takes precedence:
- a pod label named "foo.AppName"
- a pod label named "bar/app-name"
- env named "BAZ_APPNAME" of any container of the pod
sidecarCheck: "env:IS_SIDECAR:true,name:sidecar" means is a container has env IS_SIDECAR=true, or its container name contains 'sidecar' then it's a sidecar container.
refLabels is used to ref pod labels as metric tags.
VM mode
app: "your app name"
ENV
There are some magic environment variables internally, their generation is relatively random, and they are not well planned.
But there are already there, and they cannot be deleted in a short time. These environment variables are not recommended. They may be deleted in a future version.
- HOSTFS: /hostfs
- DOCKER_SOCK: /var/run/docker.sock
Please check: appconfig.go
E2E testing
Check this doc for more details.
# Run all E2E tests without building image from code
./scripts/test/e2e/all.sh

# Build image from code, and then run all E2E tests
build=1 ./scripts/test/e2e/all.sh
Deployment for testing
This method is for quick local verification and is not suitable for production-level deployment.
Now there is a test scene named scene-default. More test scenes will be added in the future.
Every scene has a docker-compose.yaml and some other resource files.
You can manually deploy a test scene using the following scripts:
# Deploy HoloInsight using docker-compose without building image from code
./test/scenes/${scene_name}/up.sh

# Build image from code, and then deploy HoloInsight using docker-compose
build=1 ./test/scenes/${scene_name}/up.sh

# Tear down HoloInsight
./test/scenes/${scene_name}/down.sh
Currently, running this test scene consumes about 5GB of memory.
Notice
These test scenes are mainly used in the development and testing phase and are not suitable for production.
Common scene shell scripts
There are many commonly used scripts under directory of each scene.
up.sh
up.sh deploys current scene using docker-compose.
build=1 debug=1 up.sh
up.sh shell options:
| Option | Description |
|---|---|
| build=1 | Build image(named holoinsight/server:latest) from source code.This image exists in local docker, and is not pushed to Docker Hub. |
| debug=1 | Enable debug mode: - Enable JVM remote debugger - Start MySQL/MongoDB/Kibana Web UI |
You can generate Markdown tables using Tables Generator.
after.sh
If this file exists and is executable, up.sh will call it after docker-compose up.
We use this script to do the following things:
- Install
HoloInsight agentintoHoloInsight server,demo-clientanddemo-server - Run Python scripts in
HoloInsight serverin background to generate demo logs - Run ttyd
HoloInsight serverin background for easy access to server
status.sh
`status.sh prints status of current deployed scene.
                Name                              Command                  State                                                    Ports
---------------------------------------------------------------------------------------------------------------------------------------------------------------------------------------
scene-default_ceresdb_1         /tini -- /entrypoint.sh          Up (healthy)
...
scene-default_server_1          /entrypoint.sh                   Up (healthy)   0.0.0.0:10923->7681/tcp, 0.0.0.0:10924->80/tcp, 0.0.0.0:10922->8000/tcp, 0.0.0.0:10921->8080/tcp

┌───────────────────────┬──────────────────────────────────────────────┐
│  Component            │  Access                                      │
├───────────────────────┼──────────────────────────────────────────────┤
│  Server_UI            │  http://xx.xxx.xx.xxx:10924                  │
│  Server_JVM_Debugger  │  xx.xxx.xx.xxx:10922                         │
│  Server_Web_Shell     │  http://xx.xxx.xx.xxx:10923                  │
│  MySQL                │  xx.xxx.xx.xxx:10917                         │
│  MySQL_Web_UI         │  http://xx.xxx.xx.xxx:10916?db=holoinsight   │
│  ...                  │  ...                                         │
└───────────────────────┴──────────────────────────────────────────────┘
down.sh
down.sh stops and removes current deployed scene.
server-exec.sh
server-exec.sh is aliased to docker exec -w /home/admin/logs/holoinsight-server -it ${server_container_id} bash
mysql-exec.sh
server-exec.sh is aliased to docker exec -it ${mysql_container_id} mysql -uholoinsight -pholoinsight -Dholoinsight
server-update.sh
server-update.sh rebuilds HoloInsight server fat jar, copies the fat jar into server container, and then restarts server process.
Test scenes
scene-default
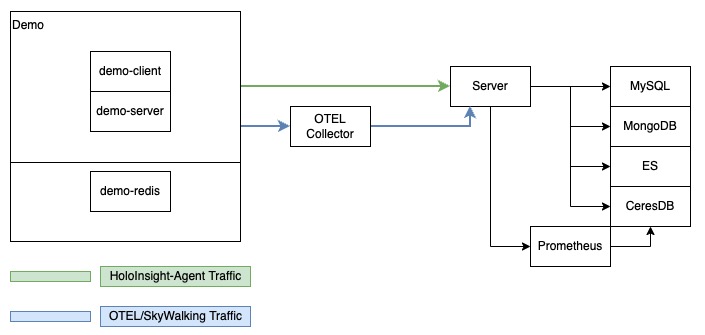
Running this scene consumes about 5GB of memory.
The scene-default scene contains the following components:
- HoloInsight server
- CeresDB
- MySQL
- MongoDB
- Prometheus
- ElasticSearch
- HoloInsight OTEL Collector
This scene also deploys several test applications for better integration testing and better demonstration effects.
- demo-client
- demo-server
- demo-redis
demo-client and demo-server have skywalking-java-agent enabled. They will report trace datum to HoloInsight OTEL Collector.
After all containers are started, the deployment script will copy HoloInsight-agent into it and execute agent in background using sidecar
mode.
Some Python scripts are mounted into /home/admin/test directory of HoloInsight server. In after.sh
Currently, running this test scene consumes about 5GB of memory.
Example:
build=1 debug=1 ./test/scenes/scene-default/up.sh

# Stop previous deployment if exists
Stopping scene-default_demo-client_1   ... done
Stopping scene-default_demo-server_1   ... done
...

# Build server using maven
[INFO] Scanning for projects...
[INFO] ------------------------------------------------------------------------
[INFO] Detecting the operating system and CPU architecture
[INFO] ------------------------------------------------------------------------
...
[INFO] all-in-one-bootstrap 1.0.0-SNAPSHOT ................ SUCCESS [  0.747 s]
[INFO] ------------------------------------------------------------------------
[INFO] BUILD SUCCESS
[INFO] ------------------------------------------------------------------------
[INFO] Total time: 14.320 s (Wall Clock)
[INFO] Finished at: 2023-04-20T16:39:13+08:00
[INFO] ------------------------------------------------------------------------

# Build server docker image
[+] Building 10.1s (29/29) FINISHED
 => [internal] load .dockerignore                                                                                                                                                                                                                                        0.0s
 => => transferring context: 2B                                                                                                                                                                                                                                          0.0s
 => [internal] load build definition from Dockerfile
 ....
 => => sending tarball                                                                                                                                                                                                                                                   3.4s
 => importing to docker

# Start deployment
debug enabled
Creating network "scene-default_default" with the default driver
Creating volume "scene-default_share" with default driver
Creating scene-default_grafana_1     ... done
Creating scene-default_agent-image_1 ... done
...

# Deployment result

                Name                              Command                  State                                                    Ports
---------------------------------------------------------------------------------------------------------------------------------------------------------------------------------------
scene-default_ceresdb_1         /tini -- /entrypoint.sh          Up (healthy)
...
scene-default_server_1          /entrypoint.sh                   Up (healthy)   0.0.0.0:10923->7681/tcp, 0.0.0.0:10924->80/tcp, 0.0.0.0:10922->8000/tcp, 0.0.0.0:10921->8080/tcp

┌───────────────────────┬──────────────────────────────────────────────┐
│  Component            │  Access                                      │
├───────────────────────┼──────────────────────────────────────────────┤
│  Server_UI            │  http://xx.xxx.xx.xxx:10924                  │
│  Server_JVM_Debugger  │  xx.xxx.xx.xxx:10922                         │
│  Server_exec          │  ./server-exec.sh                            │
│  Server_Web_Shell     │  http://xx.xxx.xx.xxx:10923                  │
│  MySQL                │  xx.xxx.xx.xxx:10917                         │
│  MySQL_exec           │  ./mysql-exec.sh                             │
│  MySQL_Web_UI         │  http://xx.xxx.xx.xxx:10916?db=holoinsight   │
│  MongoDB_Web_UI       │  http://xx.xxx.xx.xxx:10918/db/holoinsight/  │
│  Kibana_Web_UI        │  http://xx.xxx.xx.xxx:10920                  │
│  Grafana_Web_UI       │  http://xx.xxx.xx.xxx:10915                  │
└───────────────────────┴──────────────────────────────────────────────┘
Misc
Update database
There is a service named mysql-data-init in docker-compose.yaml. It is used to initialize database tables and pre-populate some data for
its test scene.
This service does three things:
- mounts
server/extension/extension-common-flyway/src/main/resources/db/migrationto/sql/0migrationin container - mounts
${test_scene_dir}/data.sqlto/sql/1data/V999999__data.sqlin container - executes all sql scripts lexicographically under
/sqlin container
Most scenes will choose to reuse the data.sql of scene-default, and the docker-compose of these scenes will refer to the data.sql of
scene-default instead of copying a copy to their own directory.
Server logs
The server is a Spring Boot app. So it use slf4j as log facade and log4j2 as log impl.
Here are some important log.
Because the project has not developed stably, the log format may be modified
agent.log
bistream.log
template.log
target.log
agent/up.log
This log file contains the 'up' event of log monitor task.
This server side logs under directory 'agent/' make it easier for developers to view the status of running log monitor tasks without login in the holoinsight-agent container.
Example:
2023-04-10 11:29:30,402 tenant=[default] workspace=[default] born_time=[10 11:29:30] event_time=[10 11:29:29] ptype=[log_monitor_up] agent=[1a986276-61f5-4350-b403-c2810f0cf4a1] t_c_key=[line_count2_2] t_c_version=[1680776155870] t_ip=[192.168.0.6] t_key=[line_count2_2/dim2:f23c168fe4b03627754c52f632c547e2] ok=[1] up=[1]
It contains the following basic fields:
- tenant
- workspace
- born_time: generate time
- event_time: event time
- ptype: payload type
- agent: agent id
- t_c_key: task config key
- t_c_version: task config version
- t_ip: task target ip
- t_key: task key
It contains the following biz fields:
- ok: ok==1 means data in current period (according to event_time) is complete, otherwise data is incomplete
- up: up==1 means the task is running, it should always be 1 if this log exists
agent/stat.log
This log file contains the 'stat' event of log monitor task.
These logs will be printed at the first second of every minute.
Example:
2023-04-10 11:33:14,389 tenant=[default] workspace=[default] born_time=[10 11:33:14] ptype=[log_monitor_stat] agent=[1a986276-61f5-4350-b403-c2810f0cf4a1] t_c_key=[agent_log_line_count_1] t_c_version=[1680772885502] t_ip=[192.168.0.6] t_key=[agent_log_line_count_1/dim2:f23c168fe4b03627754c52f632c547e2] f_bwhere=[0] f_delay=[0] f_gkeys=[0] f_group=[0] f_ignore=[0] f_logparse=[0] f_timeparse=[0] f_where=[0] in_broken=[0] in_bytes=[1957] in_groups=[13] in_io_error=[0] in_lines=[13] in_miss=[0] in_processed=[13] in_skip=[0] out_emit=[1] out_error=[0]
It contains same basic fields as agent/up.log.
It contains the following biz fields:
- in_io_error: file read error count
- in_miss: in_miss==1 means target file doesn't exist
- in_bytes: the bytes of logs ingested
- in_lines: the lines of logs ingested
- in_groups: the line groups of logs ingested ( see log-multiline )
- in_skip: in_skip==1 means there is some problem leading to file offset skipping (such as the log file is truncated by other processes when read)
- in_broken: in_broken==1 means it is broken when reading from file (currently a line with very long length will cause this problem)
- f_bwhere: the number of rows filtered out because of 'BeforeParseWhere'
- f_ignore: the number of lines filtered out because of 'well known useless logs' (currently Java exception stack logs when use single-line mode)
- f_logparse: the number of groups filtered out because of 'log parse error'
- f_timeparse: the number of groups filtered out because of 'timestamp parse error'
- f_where: the number of groups filtered out because of 'where error' or 'fail to pass where test'
- f_group: the number of groups filtered out because of 'group' stage
- f_gkeys: the number of groups filtered out because of 'groups exceed the groupMaxKeys limit'
- f_delay: the number of groups filtered out because of 'group' stage
- in_processed: the number of processed groups
- out_emit: emit count
- out_error: emit error count
agent/digest.log
This log file contains the 'digest' event of log monitor task.
The content contained in the current file is relatively complicated. It contains much important information of Agent and log monitor tasks. Currently, it contains the following events:
- agent bootstrap event
- log consumer start event
- log consumer stop event
- log consumer update event
Agent logs
This directory contains documentation for the front-end code.
At present, many documents are missing and need to be improved.
Compile requirements:
- node
- yarn
Build dist
./scripts/front/build.sh
Build result:
- front/dist/: html/js/css/assets
- front/dist.zip: the zip of
front/dist/
Before you run the front-end code, you need to have a running HoloInsight backend, you can refer to this document to start a backend.
Suppose the address of the backend is http://xx.xx.xx.xx:12345, you need to configure ./front/config/config.ts:
export default defineConfig({
  ...
  proxy: {
    '/webapi/': {
      target: 'http://xx.xx.xx.xx:12345',
      changeOrigin: true,
    },
  }
  ...
});
Run front dev server:
cd front/ && yarn run dev
Example output:
$yarn run dev
yarn run v1.22.19
$ max dev
info  - Umi v4.0.68
info  - Preparing...
info  - MFSU eager strategy enabled
[HPM] Proxy created: /webapi/  -> http://xx.xx.xx.xx:12345
event - [MFSU][eager] start build deps
info  - [MFSU] buildDeps since cacheDependency has changed
        ╔════════════════════════════════════════════════════╗
        ║ App listening at:                                  ║
        ║  >   Local: http://localhost:8000                  ║
ready - ║  > Network: http://xx.xx.xx.xx:8000                ║
        ║                                                    ║
        ║ Now you can open browser with the above addresses↑ ║
        ╚════════════════════════════════════════════════════╝
info  - [MFSU][eager] worker init, takes 562ms
...
Visit the front pages at http://xx.xx.xx.xx:8000.
HoloInsight Internals
This directory contains HoloInsight internal details or uncategorized documentation.
Solution of Logstash
input {
  stdin {
    codec => multiline {
      pattern => "pattern, a regexp"
      negate => "true" or "false"
      what => "previous" or "next"
    }
  }
}
The meaning of this configuration expression is that lines which match 'pattern' and 'negate' are belong to 'what' line group.
A concrete example:
2023-03-25 16:27:56 [INFO] [main] log foo bar baz
java.lang.RuntimeException: foobar message
  at io.holoinsight.foo.bar.baz ...
2023-03-25 16:27:57 [INFO] [main] log foo bar baz
java.lang.RuntimeException: foobar message
  at io.holoinsight.foo.bar.baz ...
input {
  stdin {
    codec => multiline {
      pattern => "^[0-9]{4}-[0-9]{2}-[0-9]{2}"
      negate => false
      what => "previous"
    }
  }
}
The meaning of this configuration expression is that lines which don't match pattern ^[0-9]{4}-[0-9]{2}-[0-9]{2} are belong to previous line group.
Line 1 '2023-03-25 16:27:56 [INFO] [main] log foo bar baz' matched, it terminates the previous line group and starts a new line group with itself as the first line.
Line 2 'java.lang.RuntimeException: foobar message' doesn't match, it is belongs to previous line group.
Line 3 'at io.holoinsight.foo.bar.baz ...' doesn't match, it is belongs to previous line group.
Line 4 '2023-03-25 16:27:57 [INFO] [main] log foo bar baz' matched, it terminates the previous line group and starts a new line group with itself as the first line.
Line 5 'java.lang.RuntimeException: foobar message' doesn't match, it is belongs to previous line group.
Line 6 'at io.holoinsight.foo.bar.baz ...' doesn't match, it is belongs to previous line group.
References
Solution of HoloInsight
{
  "multiline": {
    "enabled": "true or false",
    "where": "condition to match",
    "what": "previous || next"
  }
}
HoloInsight's multi-line solution is basically aligned with Logstash. But it has its own characteristics.
We combine pattern and negate and use where to express. where is more expressive than pattern + negate.
A concrete example:
2023-03-25 16:27:56 [INFO] [main] log foo bar baz
java.lang.RuntimeException: foobar message
  at io.holoinsight.foo.bar.baz ...
2023-03-25 16:27:57 [INFO] [main] log foo bar baz
java.lang.RuntimeException: foobar message
  at io.holoinsight.foo.bar.baz ...
{
  "multiline": {
    "enabled": true,
    "where": {
      "not": {
        "regexp": {
          "elect": {
            "type": "line"
          },
          "pattern": "^[0-9]{4}-[0-9]{2}-[0-9]{2}"
        }
      }
    },
    "what": "previous"
  }
}
The meaning of this configuration expression is that lines which don't match pattern ^[0-9]{4}-[0-9]{2}-[0-9]{2} are belong to previous line group.
Line 1 '2023-03-25 16:27:56 [INFO] [main] log foo bar baz' matched, it terminates the previous line group and starts a new line group with itself as the first line.
Line 2 'java.lang.RuntimeException: foobar message' doesn't match, it is belongs to previous line group.
Line 3 'at io.holoinsight.foo.bar.baz ...' doesn't match, it is belongs to previous line group.
Line 4 '2023-03-25 16:27:57 [INFO] [main] log foo bar baz' matched, it terminates the previous line group and starts a new line group with itself as the first line.
Line 5 'java.lang.RuntimeException: foobar message' doesn't match, it is belongs to previous line group.
Line 6 'at io.holoinsight.foo.bar.baz ...' doesn't match, it is belongs to previous line group.
GPU
HoloInsight-Agent uses a query on the nvidia-smi binary to pull GPU stats including memory and GPU usage, temp and other.
This GPU plugin is automatically activated if nvidia-smi is present.
This plugin does not require any configuration.
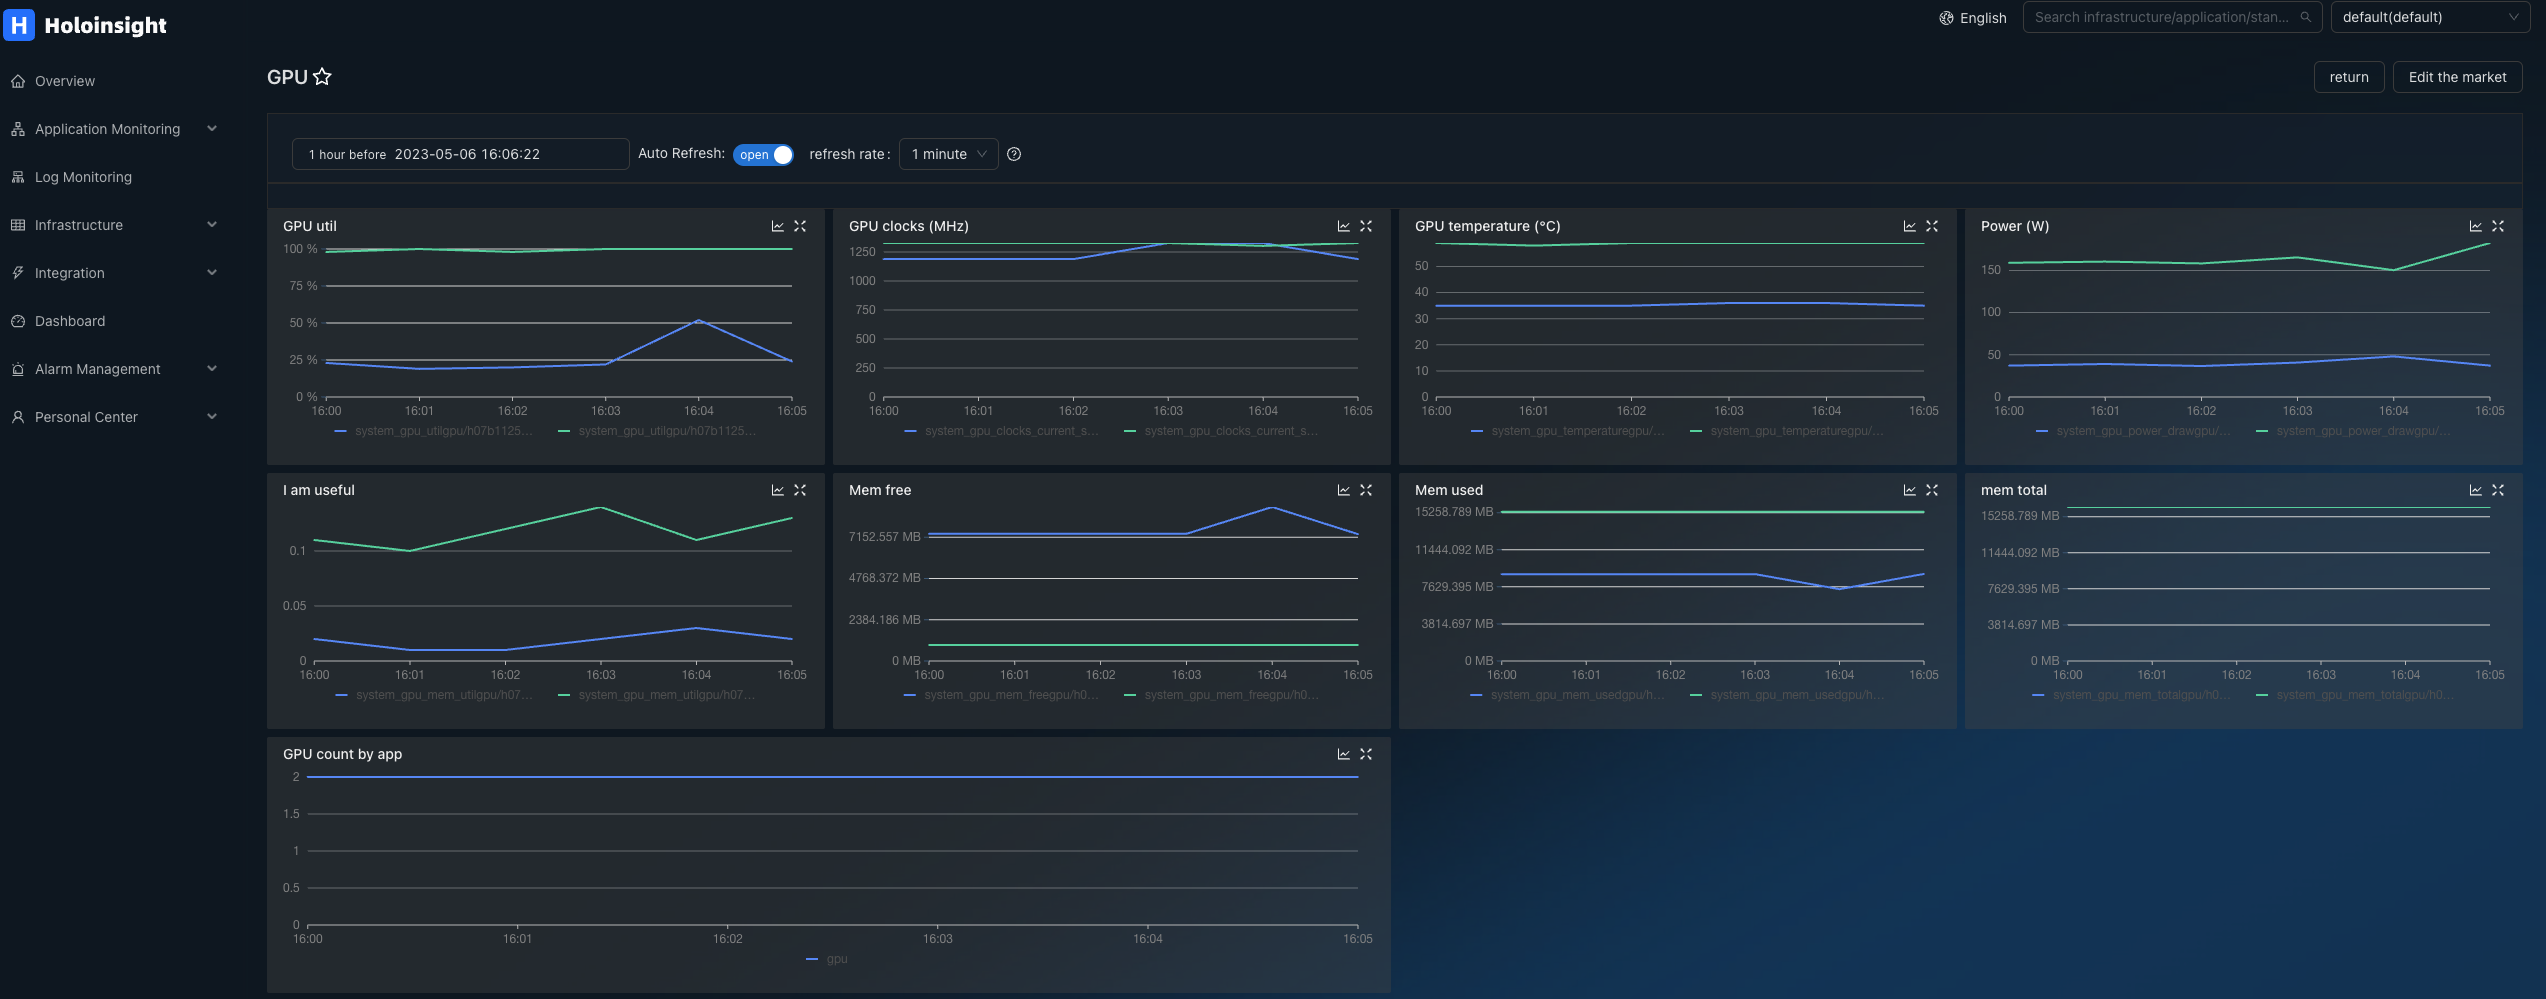
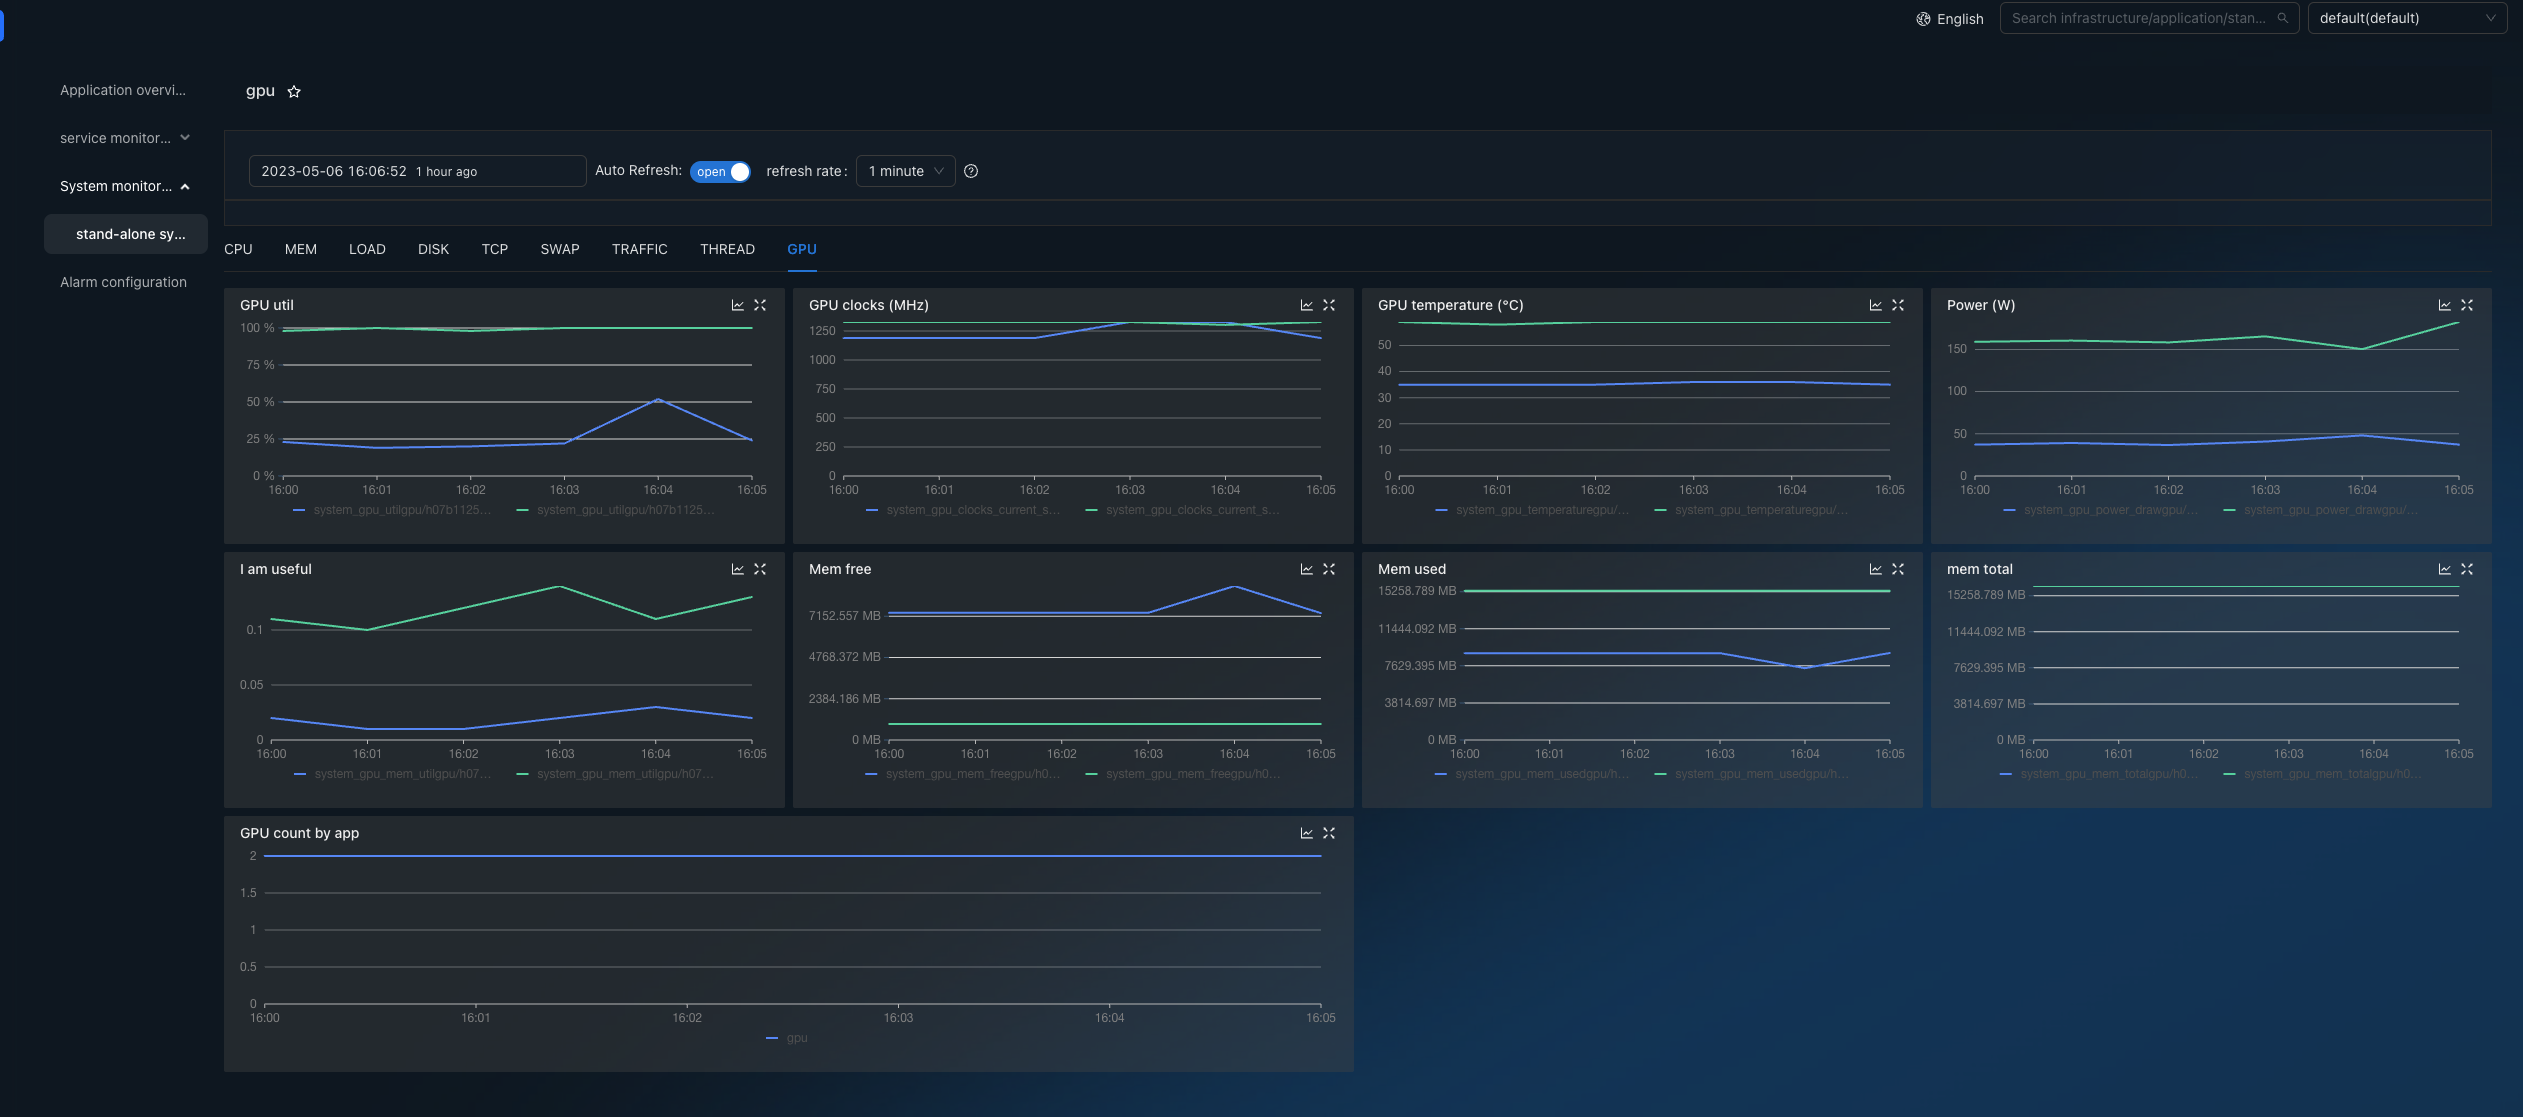
nvidia-smi commands
List all GPUs
nvidia-smi -L
Query GPU,memory utilization
nvidia-smi --query-gpu=index,utilization.gpu,utilization.memory --format=csv
nvidia-smi --help-query-gpu
Query memory usage
nvidia-smi --query-gpu=index,memory.used,memory.free,memory.total --format=csv
Query version and driver
nvidia-smi --query-gpu=index,name,vbios_version,driver_version --format=csv
Query temperature,power,clocks
nvidia-smi --query-gpu=index,power.draw,temperature.gpu,clocks.current.sm,clocks.current.memory,fan.speed --format=csv
Query GPU used memory of pids
nvidia-smi --query-compute-apps=gpu_uuid,pid,used_memory --format=csv
How to use it
Deploy the algorithm service and invoke the interface
POST http://ai:5000/anomaly_detect
InPut
| Parameter | Subparameter | Data type | Required | Remarks |
|---|---|---|---|---|
| traceId | String | TRUE | traceId | |
| intervalTime | Long | TRUE | Timing data interval time (ms) | |
| detectTime | Long | TRUE | Detection time, whole minutes | |
| inputTimeSeries | Dict[int, float] | TRUE | Input time sequence data {k1: v1, k2:v2} | |
| algorithmConfig | sensitivity | String | TRUE | Algorithm sensitivity,high/mid/low |
| detectType | String | TRUE | Detection type: up/down/fallZero | |
| ruleConfig | defaultDuration | Int | FALSE | Duration of an alarm. The default value is 2 |
| customUpThreshold | float | FALSE | Upper limit alarm | |
| customDownThreshold | float | FALSE | Lower limit alarm | |
| customChangeRate | float | FALSE | If the change rate exceeds the threshold, an alarm is generated |
OutPut
| Parameter | Data type | Remarks |
|---|---|---|
| traceId | String | traceId |
| isSuccessful | bool | Task execution or not:True/False |
| errorCode | int | Error code |
| detectTime | Long | Detection time |
| isException | bool | Check whether data is abnormal:True/False |
FOR EXAMPLE
Example For Value Rise Detect
InPut
{
  "inputTimeSeries": {
    "1681710540000": 559,
    "1681710600000": 597,
    "1681710660000": 505,
    "1681710720000": 572,
    "1681710780000": 515,
    "1681710840000": 552,
    "1681710900000": 549,
    "1681710960000": 521,
    "1681711020000": 500,
    "1681711080000": 564,
    "1681711140000": 517,
    "1681711200000": 5000
  },
    "intervalTime": 60000,
    "detectTime": 1681711200000,
    "algorithmConfig": {
    "algorithmType": "up",
    "sensitivity": "mid"
  },
    "ruleConfig": {
    "defaultDuration": 1,
    "customChangeRate": 0.1
  }
}
OutPut
{
  "detectTime": 1681711200000,
  "errorCode": {},
  "isException": true,
  "isSuccessful": true,
  "traceId": null
}
Example For Value Fall Detect
InPut
{
  "inputTimeSeries": {
    "1681710540000": 459,
    "1681710600000": 497,
    "1681710660000": 405,
    "1681710720000": 482,
    "1681710780000": 435,
    "1681710840000": 452,
    "1681710900000": 445,
    "1681710960000": 421,
    "1681711020000": 400,
    "1681711080000": 445,
    "1681711140000": 417,
    "1681711200000": 1
  },
    "intervalTime": 60000,
    "detectTime": 1681711200000,
    "algorithmConfig": {
    "algorithmType": "down",
    "sensitivity": "mid"
  },
    "ruleConfig": {
    "defaultDuration": 1,
    "customChangeRate": 0.1
  }
}
OutPut
{
  "detectTime": 1681711200000,
  "errorCode": {},
  "isException": true,
  "isSuccessful": true,
  "traceId": null
}
Dialcheck
Agent code: pkg/plugin/input/dialcheck
Overview
Dialcheck c the connectivity of the target address port.
package dialcheck

type Config struct {
    // tcp or udp
    Network     string        `json:"network"`
    // ip:port
    Addr        string        `json:"addr"`
    // connection timeout
    Timeout     time.Duration `json:"timeout"`
    // How many times to check connection. If any successful connection, the final result is success.
    Times       int           `json:"times"`
    // networkMode AGENT: create network connection from agent to target addr
    // networkMode POD: using `docker exec` to check target addr inside the target pod
    NetworkMode string        `json:"networkMode"`
}
Result:
- up: 1 for network up or else 0
- down: 1 for network down or else 0
- cost: average detection time
The value of the cost field is obtained by counting the execution time of net.Dial(), and it is not necessarily accurate.
If the task from server side does not specify a 'metircPreifx', "dialcheck_" will be used. So the final metric results will be:
- dialcheck_up
- dialcheck_down
- dialcheck_cost
NetworkMode details
When networkMode is 'AGENT', agent creates network connection from agent to target addr. This works for most scenarios.
When networkMode is 'POD', agent uses 'docker exec' to run the helper binary, which is installed when agent discovers the pod. This helper binary will execute the logic of network detection. This method is suitable for scenarios with network isolation (between agent and target pod).
In addition, networkMode may add a new value of "NETNS" (but it has not yet been implemented).
As the name suggests, it uses Linux's setns to enter the network namespace of the target container, and then performs network probing.
It can also break through the network isolation in some scenarios.
Log time parsing
The parsing of the timestamp has the following steps:
- To extract the time string, you need to use elect to extract the time string
- Determine the time zone, if the time zone of the container is empty, then use the time zone
- Try to parse the time string into a millisecond timestamp, this step needs to understand the format and layout of the time string
The extraction configuration of the timestamp is defined by the following structure:
type TimeConf struct {
    Type string `json:"type"`
    Elect *Elect `json:"elect"`
    Format string `json:"format"`
    Layout string `json:"layout"`
    Timezone string `json:"timezone"`
}
type defines the overall parsing type:
auto: Fully automatic parsing: If you choose auto mode, then try to automatically extract the time from the log line, it is only applicable to simple logs with the timestamp at the beginning of the line, and all other fields do not need to be configured at this timeprocessTime: The time when the log is read is used as the timestamp, which has a large uncertainty. At this time, all other fields do not need to be configuredelect: Extract the timestamp string from the log line, and then parse it into a millisecond-level timestamp. In this case, you need to use the elect/format/layout/timezone field
For the case of type = elect:
elect: used to extract the time stringformat: describes the style of the time string: a.unix: second-level timestamp b.unixMilli: millisecond timestamp c.golangLayout: Its format is described by a Golang-style string, and the Layout field needs to be used at this time d.auto: A scenario similar to type=auto, it can automatically guess the format and layout of the timestamplayout: only used when format = golangLayout, layout is a Golang-style time formattimezone: time zone, it is not recommended to fill in; it is recommended that the time zone of the log and the container be consistent; if the container time zone resolution is not empty, the container time zone is preferred
Example
Example 1: Simple logs:
- 2023-08-04 11:50:05 [main] biz log biz log biz log ...
- 2023-08-04 11:50:05.123 [main] biz log biz log biz log ...
- 2023-08-04 11:50:05,123 [main] biz log biz log biz log ...
- 2023-08-04T11:50:05 [main] biz log biz log biz log ...
- 2023-08-04 11:50:05 +08:00 [main] biz log biz log biz log ...
At this time, the time zone of the container will be used to parse the time.
{
   "type": "auto"
}
Example 2: Each line of the user's log is a json string, and the timestamp is in the myTime field. For the time format of myTime, field parsing is used.
{"bizField1":"1", "bizField2":"2", "myTime": "2023-08-04 11:50:05"}
{
   "type": "elect",
   "elect": {
      "type": "refName",
         "refName": {
         "name": "myTime"
      }
   },
   "format": "auto"
}
At this time, the time zone of the container will be used to parse the time.
Example 3: Each log line of the user is a json string, and the timestamp is in the myTime field. The time format of myTime is parsed in the "2006-01-02 15:04:05" Golang-style time format.
{"bizField1":"1", "bizField2":"2", "myTime": "2023-08-04 11:50:05"}
{
   "type": "elect",
   "elect": {
      "type": "refName",
      "refName": {
         "name": "myTime"
      }
   },
   "format": "golangLayout",
   "layout": "2006-01-02 15:04:05"
}
At this time, the time zone of the container will be used to parse the time.
Example 4: Use processing time as timestamp
{
   "type": "processTime"
}
Automatic log time parsing
As mentioned above, HoloInsight-Agent can do some automatic time parsing. In fact, it has built-in support for parsing some common time formats.
When using log monitoring, if no time column is explicitly configured, HoloInsight-Agent will try to automatically parse the time from the log. But it can only support a few common formats.
The following formats are supported:
- "2006-01-02 15:04:05",
- "2006/01/02 15:04:05",
- "2006-01-02T15:04:05",
- "2006 Jan/02 15:04:05",
- "02/Jan/2006 15:04:05",
- "Jan 02 2006 15:04:05",
- "01/02/2006 15:04:05",
Each format allows a prefix of 4 characters or fewer. So '[2006-01-02 15:04:05] INFO [main] xxx biz log' can also be parsed normally.
In addition, second-level timestamps and millisecond-level timestamps are also supported, but this requires the timestamp to appear at the beginning of the line, and the length is 10 (second-level timestamp) or 13 (millisecond-level timestamp), and there is no prefix. For example:
- '1668517987 INFO [main] xxx biz log' can also be parsed normally'
- '1668517987000 INFO [main] xxx biz log' can also be parsed normally'
If your timestamps can't be parsed automatically, then maybe:
- Timestamp format is not common
- The position of the timestamp is not at the beginning of the line
At this point, you need to explicitly configure the timestamp parsing method on the page:
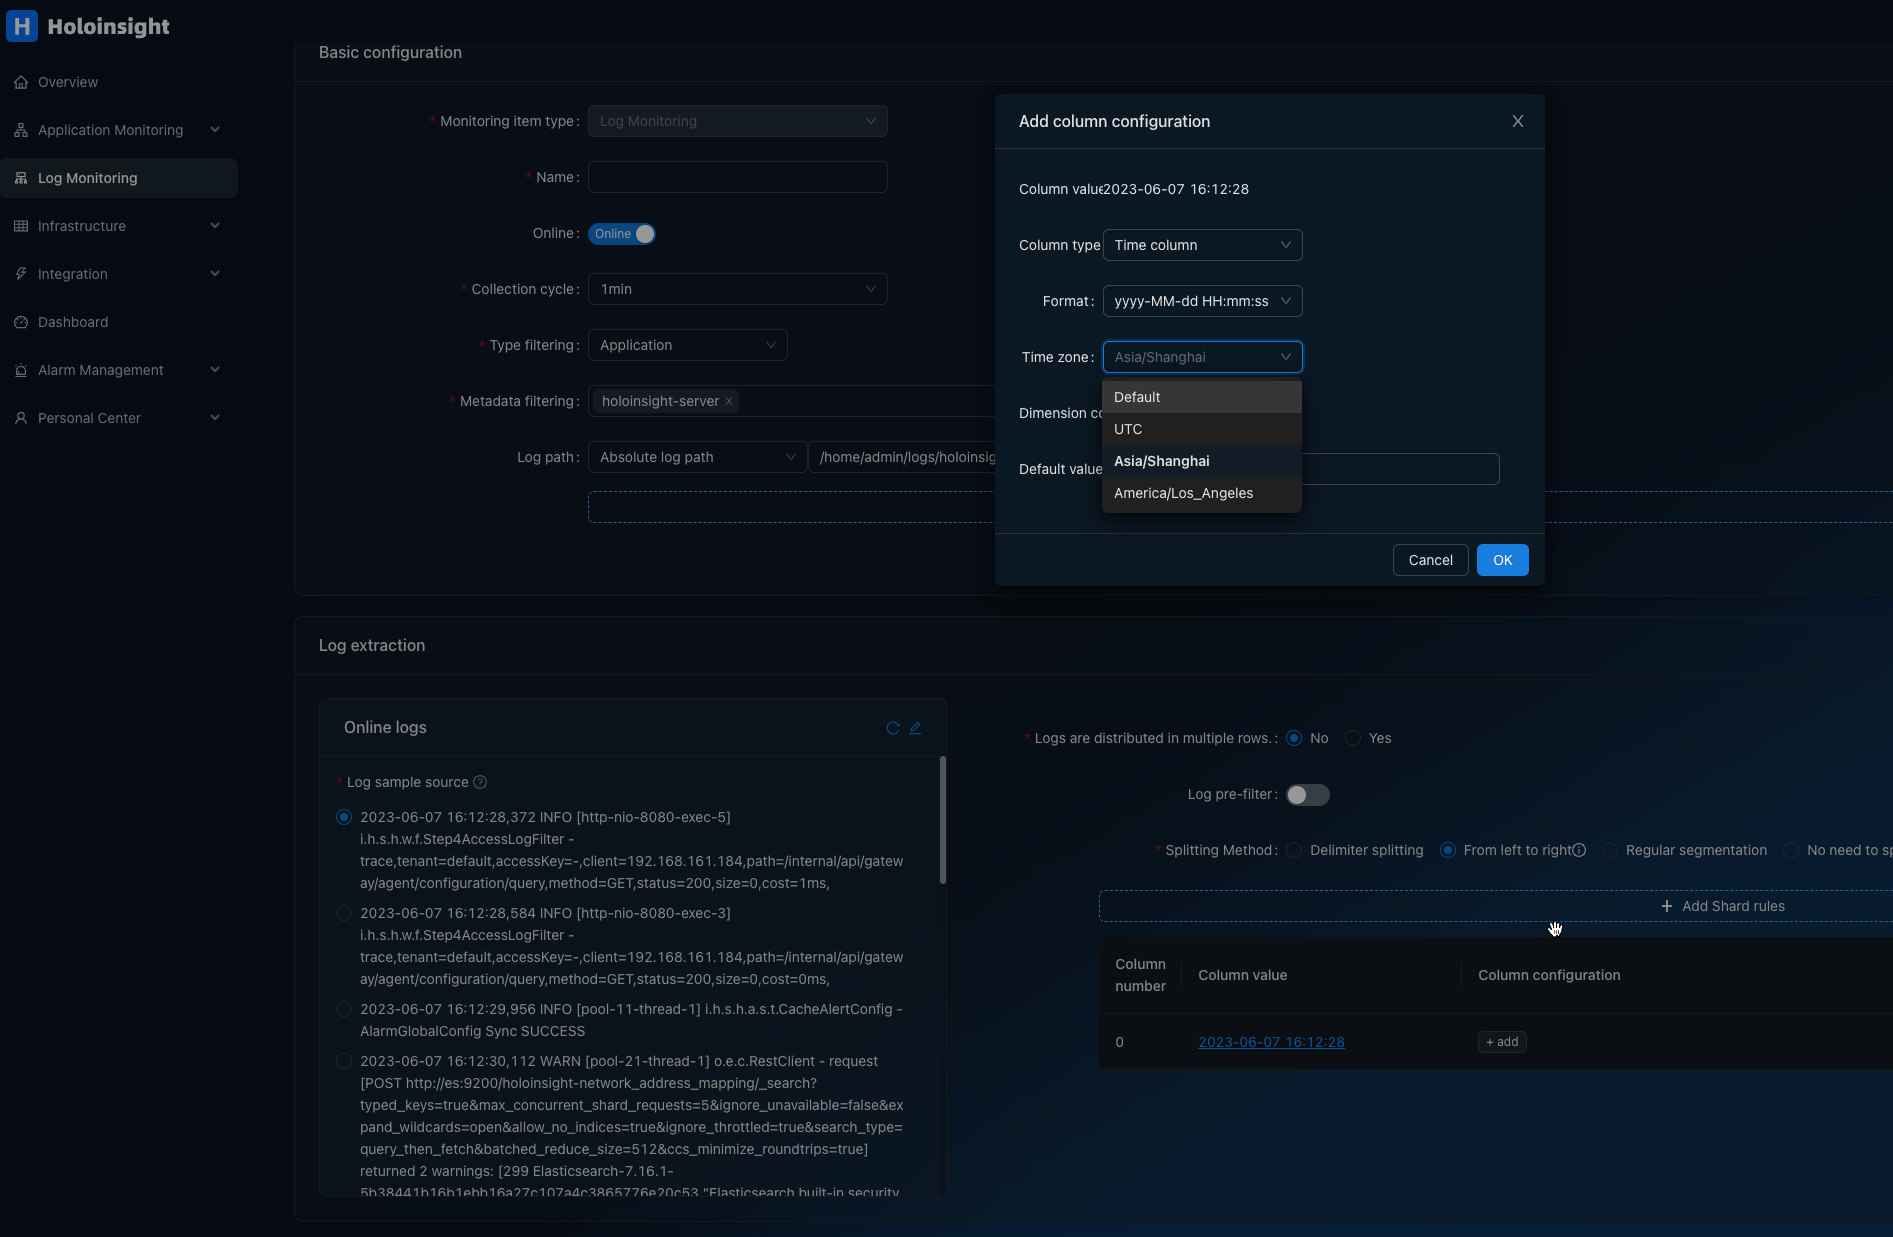
Log timezone
When parsing a string to time, the timezone is required.
HoloInsight-Agent use the Env TZ or /etc/localtime of main container of target pod as the timezone to parse time in logs.
In most cases, a pod contains a business container and sandbox container. The business container is the main container of the pod. When a pod contains more than 2 containers (including sandbox container), non-sandbox containers will be divided into biz and sidecar containers. At this time, it is required that there is only one business container, otherwise the acquisition target is not unique. The judgment method of sidecar container can refer to the code of HoloInsight-Agent: DefaultSidecarCheckHookInstance.
For details, refer to this article.
The processing sequence is as follows:
- Check if there is an Env named
TZin the container spec, and if so, use it - If the
/etc/localtimeof the container is a symbol link, then parse timezone info from the link (such as/usr/share/zoneinfo/Asia/Shanghai=>Asia/Shanghai) - If the
/etc/localtimeof the container is a regular file, then parse timezone info and use it
Notice: timezone info of a container is updated only once in agent's lifecycle.
Updating /etc/localtime after the container starts has no effect on the current agent and is not persistent.
An extreme error scenario
When the user mounts /usr/share/zoneinfo/Asia/Shanghai of the host to /etc/localtime of the container, the real result may be:
/etc/localtimein the container is still a symbol link, pointing to/usr/share/zoneinfo/UTCor../usr/share/zoneinfo/UTC- The content of
/usr/share/zoneinfo/UTCin the container becomes the content ofAsia/Shanghai.
The reason for this phenomenon is that the k8s mount action will follow symbol link.
In order to get correct results, we must read the timezone file once.
In fact, /usr/share/zoneinfo/UTC is covered by mount, but it cannot be seen from the mounts information (because there are some symbol links in the middle).
Therefore, the read request must be initiated from inside the container.
Now, while this situation itself is uncommon and problematic, Holoinsight-Agent still parses the time correctly.
For logs with time zone information
2006-01-02 15:04:05 +08:00 xxx logs ...
Currently, HoloInsight-Agent does not take advantage of such timezones in logs.
How to set timezone in a container
Use one of the following methods to set the time zone of the container. The scheme with the higher serial number is recommended.
- Add following commands to your Dockerfile:
RUN ln -snf /usr/share/zoneinfo/Asia/Shanghai /etc/localtime
- Add Env TZ to your container k8s yaml(TODO required Agent version ?)
- name: TZ
  value: Asia/Shanghai
Log charset
When read logs from file, HoloInsight-Agent use github.com/saintfish/chardet to detect the real charset of logs.
But this guess is not necessarily correct, its result depends on the given log sample, and it may be wrong, which results in mojibake.
Now only support for UTF8 and GB18030 is good.
It is recommended to only use UTF8 encoding when printing logs to avoid garbled characters in various links.
Lossless restart and deploy
Lossless restart
When the Agent is ready to exit due to receiving a SIGTERM signal, it saves its task execution state to $CWD/data/state (usually /usr/local/holoinsight/agent/data/state).
When the Agent starts, it tries to load $CWD/data/state (valid for 2 minutes from creation) to restore task state.
Lossless deploy/upgrade
Config maxSurge>0 in k8s yaml:
  updateStrategy:
    type: RollingUpdate
    rollingUpdate:
      maxSurge: 1
      maxUnavailable: 0
After the agent starts, it will listen to $CWD/data/transfer.sock.
When holoinsight-agent is upgraded using maxSurge mode through k8s, k8s will first create a new pod, and then delete the old pod after the new pod is ready.
When the new pod starts, it will try to connect $CWD/data/transfer.sock to the old pod for state transfer. After the state transfer is completed, the new pod starts to work normally, and the old pod is still alive but not working, waiting for k8s to reclaim resources.
Deployment
This article introduces the deployment of HoloInsight and HoloInsight Agent based on Helm.
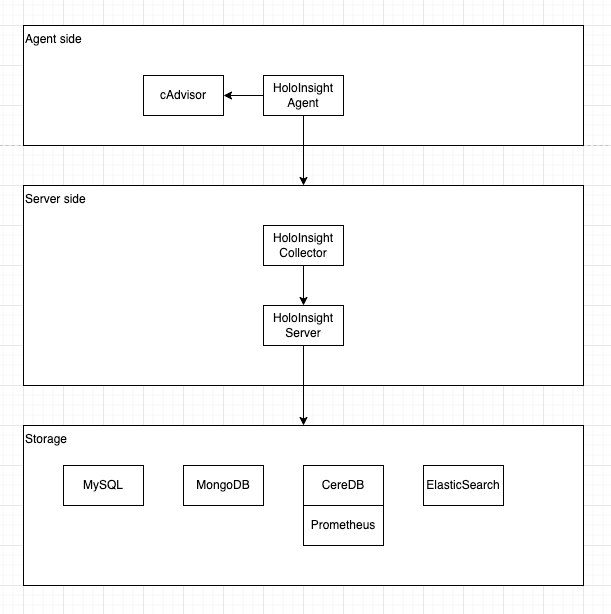
What you need:
- Basic knowledge of K8s
- Basic knowledge of Helm v3
- A K8s cluster (specification > 4G8G), it is recommended to use K3s for practice
- A development environment for Linux or Mac
- Git
Deploy HoloInsight
Note that in this example, the database part will also be deployed together with the Helm Chart, but they are unreliable and do not use any high-availability solutions and persistent storage, which means that once you redeploy, you will lose all data. In production-level practice, you need to prepare these four databases (manually deploy or purchase services provided by cloud vendors), and make them highly available at the production level.
Upgrade or install (update) the latest version of HoloInsight in the holoinsight-server namespace:
# Add holoinsight repository
helm repo add holoinsight https://traas-stack.github.io/holoinsight-helm-charts/

kubectl create namespace holoinsight-server
helm -n holoinsight-server upgrade --install holoinsight holoinsight/holoinsight
If you want to install a specific version:
helm -n holoinsight-server upgrade --install --version 1.0.0 holoinsight holoinsight/holoinsight
Wait for all Pods to be in Ready state. You can visually observe the progress using the following command:
kubectl -n holoinsight-server get pods -w
Example output:
$ kubectl -n holoinsight-server get pods -w

NAME                                      READY   STATUS    RESTARTS   AGE
holoinsight-mongo-0                       0/1     Running   0          9s
holoinsight-ceresdb-0                     0/1     Running   0          9s
holoinsight-es-0                          0/1     Running   0          9s
holoinsight-server-0                      0/1     Running   0          9s
holoinsight-collector-7ff4bd95b7-jfnj4    0/1     Running   0          9s
holoinsight-prometheus-69795584d6-w7njb   0/1     Running   0          9s
holoinsight-mysql-0                       1/1     Running   0          9s
holoinsight-mongo-0                       1/1     Running   0          13s
holoinsight-collector-7ff4bd95b7-jfnj4    1/1     Running   0          13s
holoinsight-ceresdb-0                     1/1     Running   0          13s
holoinsight-es-0                          1/1     Running   0          17s
holoinsight-prometheus-69795584d6-w7njb   1/1     Running   0          22s
holoinsight-server-0                      1/1     Running   0          47s
Initialize HoloInsight
When deploying for the first time, HoloInsight needs to do some initialization. This step can be skipped for non-first-time deployments. The current product layer lacks an initialization guide page, so it needs to be initialized through a script. It does the following:
- Add a tenant named "default" and configure its storage to use CeresDB
- Add an apikey "default"
- Import the JVM plugin
- Add the application monitoring left menu configuration
git clone https://github.com/traas-stack/holoinsight-helm-charts
cd holoinsight-helm-charts
# The behavior of some scripts depends on a specific version. If the HoloInsight you just installed is not the latest version,
# It is recommended that you use git checkout holoinsight-1.0.0 to switch to the corresponding version.
./scripts/holoinsight/init.sh
Example output:
[database] wait for [holoinsight-mysql] to be ready
partitioned roll out complete: 1 new pods have been updated...

[database] wait for [holoinsight-server] to be ready
partitioned roll out complete: 1 new pods have been updated...

[database] populate init data
mysql: [Warning] Using a password on the command line interface can be insecure.
done
Visit the product page
In production-level practice, you need to manually create Ingress and expose it as a domain name.
Usually the configuration of Ingress depends on the specific deployment environment, so it is not provided in this Helm Chart.
The page access method provided here can only be used in the testing phase.
Map HoloInsight port 80 to local port 8080:
cd holoinsight-helm-charts
./scripts/holoinsight/server-port-forward.sh
Example output:
Visit HoloInsight at http://localhost:8080
Forwarding from 127.0.0.1:8080 -> 80
Forwarding from [::1]:8080 -> 80
Handling connection for 8080
Just visit http://localhost:8080.
At this point there is no data on the page, you need to install HoloInsight-Agent and sample application to generate some data.
Customize HoloInsight
For example, modify the image version and increase the container size. For details about which customizations are supported, please refer to the Chart content. Create a new file values.yaml
server:
  image: holoinsight/server:ANOTHER_TAG
  resources:
    requests:
      cpu: "4"
      memory: "8Gi"
    limits:
      cpu: "4"
      memory: "8Gi"
# applicationYaml: override application.yaml of Spring Boot
For more configuration, see server-bootstrap-configuration.
Execute the following command to install or upgrade (update):
helm -n holoinsight-server upgrade --install holoinsight -f values.yaml
View the deployment
helm -n holoinsight-server list
Uninstall HoloInsight
helm -n holoinsight-server uninstall holoinsight
Deploy HoloInsight Agent
Edit values.yaml
apikey: "default"
common_version: '1'
workspace: "default"
cluster: "default"

server:
  registry:
    addr: registry.holoinsight-server:7202
  gateway:
    addr: gateway.holoinsight-server:19610
  secure: false


# If you are using containerd or containerd based k3s, you should mount containerd run directory into cadvisor.
# The following is the config for k3s+containerd.
#cadvisor:
#  volumes:
#  - name: containerd
#    hostPath:
#      path: /run/k3s/containerd
#  volumeMounts:
#  - name: containerd
#    mountPath: /run/containerd
#    readOnly: true
For more configuration, see agent-bootstrap-configuration.
To install or upgrade (update) HoloInsight-Agent in the holoinsight-agent namespace:
kubectl create namespace holoinsight-agent
helm -n holoinsight-agent upgrade --install holoinsight-agent holoinsight/holoinsight-agent -f values.yaml
Uninstall HoloInsight-Agent
```bash
helm -n holoinsight-agent uninstall holoinsight-agent
More installation methods
helm -n holoinsight-server upgrade --install holoinsight https://github.com/traas-stack/holoinsight-helm-charts/releases/download/holoinsight-0.2.3/holoinsight-0.2.3.tgz

# If you can't access the public network, you can download it locally by other means and then use it.
helm -n holoinsight-server upgrade --install holoinsight holoinsight-1.0.0.tgz

# If you want to modify the Chart itself, then deploy it without publishing the Chart.
helm -n holoinsight-server upgrade --install holoinsight PATH_TO_YOUR_holoinsight_chart_dir
Check here for more details.
Install the sample applications
Before exploring HoloInsight, it is recommended to install 2 instances and apply them to the K8s cluster. Let them generate some call traffic to improve the display on HoloInsight.
cd holoinsight-helm-charts
# Install sample applications
./scripts/holoinsight/demo-up.sh

# Uninstall sample applications
./scripts/holoinsight/demo-down.sh
Exploring HoloInsight for the first time
TODO
Deployment
This article introduces the deployment of HoloInsight and HoloInsight Agent based on Helm.

What you need:
- Basic knowledge of K8s
- Basic knowledge of Helm v3
- A K8s cluster (specification > 4G8G), it is recommended to use K3s for practice
- A development environment for Linux or Mac
- Git
Deploy HoloInsight
Note that in this example, the database part will also be deployed together with the Helm Chart, but they are unreliable and do not use any high-availability solutions and persistent storage, which means that once you redeploy, you will lose all data. In production-level practice, you need to prepare these four databases (manually deploy or purchase services provided by cloud vendors), and make them highly available at the production level.
Upgrade or install (update) the latest version of HoloInsight in the holoinsight-server namespace:
# Add holoinsight repository
helm repo add holoinsight https://traas-stack.github.io/holoinsight-helm-charts/

kubectl create namespace holoinsight-server
helm -n holoinsight-server upgrade --install holoinsight holoinsight/holoinsight
If you want to install a specific version:
helm -n holoinsight-server upgrade --install --version 1.0.0 holoinsight holoinsight/holoinsight
Wait for all Pods to be in Ready state. You can visually observe the progress using the following command:
kubectl -n holoinsight-server get pods -w
Example output:
$ kubectl -n holoinsight-server get pods -w

NAME                                      READY   STATUS    RESTARTS   AGE
holoinsight-mongo-0                       0/1     Running   0          9s
holoinsight-ceresdb-0                     0/1     Running   0          9s
holoinsight-es-0                          0/1     Running   0          9s
holoinsight-server-0                      0/1     Running   0          9s
holoinsight-collector-7ff4bd95b7-jfnj4    0/1     Running   0          9s
holoinsight-prometheus-69795584d6-w7njb   0/1     Running   0          9s
holoinsight-mysql-0                       1/1     Running   0          9s
holoinsight-mongo-0                       1/1     Running   0          13s
holoinsight-collector-7ff4bd95b7-jfnj4    1/1     Running   0          13s
holoinsight-ceresdb-0                     1/1     Running   0          13s
holoinsight-es-0                          1/1     Running   0          17s
holoinsight-prometheus-69795584d6-w7njb   1/1     Running   0          22s
holoinsight-server-0                      1/1     Running   0          47s
Initialize HoloInsight
When deploying for the first time, HoloInsight needs to do some initialization. This step can be skipped for non-first-time deployments. The current product layer lacks an initialization guide page, so it needs to be initialized through a script. It does the following:
- Add a tenant named "default" and configure its storage to use CeresDB
- Add an apikey "default"
- Import the JVM plugin
- Add the application monitoring left menu configuration
git clone https://github.com/traas-stack/holoinsight-helm-charts
cd holoinsight-helm-charts
# The behavior of some scripts depends on a specific version. If the HoloInsight you just installed is not the latest version,
# It is recommended that you use git checkout holoinsight-1.0.0 to switch to the corresponding version.
./scripts/holoinsight/init.sh
Example output:
[database] wait for [holoinsight-mysql] to be ready
partitioned roll out complete: 1 new pods have been updated...

[database] wait for [holoinsight-server] to be ready
partitioned roll out complete: 1 new pods have been updated...

[database] populate init data
mysql: [Warning] Using a password on the command line interface can be insecure.
done
Visit the product page
In production-level practice, you need to manually create Ingress and expose it as a domain name.
Usually the configuration of Ingress depends on the specific deployment environment, so it is not provided in this Helm Chart.
The page access method provided here can only be used in the testing phase.
Map HoloInsight port 80 to local port 8080:
cd holoinsight-helm-charts
./scripts/holoinsight/server-port-forward.sh
Example output:
Visit HoloInsight at http://localhost:8080
Forwarding from 127.0.0.1:8080 -> 80
Forwarding from [::1]:8080 -> 80
Handling connection for 8080
Just visit http://localhost:8080.
At this point there is no data on the page, you need to install HoloInsight-Agent and sample application to generate some data.
Customize HoloInsight
For example, modify the image version and increase the container size. For details about which customizations are supported, please refer to the Chart content. Create a new file values.yaml
server:
  image: holoinsight/server:ANOTHER_TAG
  resources:
    requests:
      cpu: "4"
      memory: "8Gi"
    limits:
      cpu: "4"
      memory: "8Gi"
# applicationYaml: override application.yaml of Spring Boot
For more configuration, see server-bootstrap-configuration.
Execute the following command to install or upgrade (update):
helm -n holoinsight-server upgrade --install holoinsight -f values.yaml
View the deployment
helm -n holoinsight-server list
Uninstall HoloInsight
helm -n holoinsight-server uninstall holoinsight
Deploy HoloInsight Agent
Edit values.yaml
apikey: "default"
common_version: '1'
workspace: "default"
cluster: "default"

server:
  registry:
    addr: registry.holoinsight-server:7202
  gateway:
    addr: gateway.holoinsight-server:19610
  secure: false


# If you are using containerd or containerd based k3s, you should mount containerd run directory into cadvisor.
# The following is the config for k3s+containerd.
#cadvisor:
#  volumes:
#  - name: containerd
#    hostPath:
#      path: /run/k3s/containerd
#  volumeMounts:
#  - name: containerd
#    mountPath: /run/containerd
#    readOnly: true
For more configuration, see agent-bootstrap-configuration.
To install or upgrade (update) HoloInsight-Agent in the holoinsight-agent namespace:
kubectl create namespace holoinsight-agent
helm -n holoinsight-agent upgrade --install holoinsight-agent holoinsight/holoinsight-agent -f values.yaml
Uninstall HoloInsight-Agent
```bash
helm -n holoinsight-agent uninstall holoinsight-agent
More installation methods
helm -n holoinsight-server upgrade --install holoinsight https://github.com/traas-stack/holoinsight-helm-charts/releases/download/holoinsight-0.2.3/holoinsight-0.2.3.tgz

# If you can't access the public network, you can download it locally by other means and then use it.
helm -n holoinsight-server upgrade --install holoinsight holoinsight-1.0.0.tgz

# If you want to modify the Chart itself, then deploy it without publishing the Chart.
helm -n holoinsight-server upgrade --install holoinsight PATH_TO_YOUR_holoinsight_chart_dir
Check here for more details.
Install the sample applications
Before exploring HoloInsight, it is recommended to install 2 instances and apply them to the K8s cluster. Let them generate some call traffic to improve the display on HoloInsight.
cd holoinsight-helm-charts
# Install sample applications
./scripts/holoinsight/demo-up.sh

# Uninstall sample applications
./scripts/holoinsight/demo-down.sh
Exploring HoloInsight for the first time
TODO
Helm charts management
Following the instructions in this document, we created a repository holoinsight-helm-charts and configured Github actions.
Whenever code is pushed to the main branch, the build and release of the helm chart will be triggered.
There are several rules:
- The Github repository can contain multiple Charts, all placed in the /charts directory
- The release will be triggered whenever the version of Chart.yaml is updated
- The corresponding tag and release will be created when publishing, unless there is an error, otherwise it will not be deleted (if you delete it, you need to cascade and change a lot of things)
- After publishing, the Github action will update the index.yaml under the gh-pages branch, which is the index file required by Helm
Then we create a repository in artifacthub.io, linking it with our Github repository.
Now HoloInsight Helm Chart can be found in artifacthub.io or Helm Cli.
helm search hub holoinsight

It takes 30 min ~ 1 hour for artifacthub.io to sync metadata from Github after our push.
Update Chart Guide
- Update Chart content
- Update version/appVersion in Chart.yaml according to https://helm.sh/docs/topics/charts/ and https://semver.org/
- Write changelogs in README.md of the Chart
- Create a PR to main branch of holoinsight-helm-charts
References
- https://helm.sh/docs/howto/chart_releaser_action/
- https://github.com/helm/chart-releaser-action
Deploy HoloInsight collector
The HoloInsight collector is a component developed based on the OpenTelemetry collector, which is used to receive, process, and export telemetry data in a vendor-neutral manner and perform authentication.
Now the HoloInsight collector can be quickly deployed based on docker-compose or k8s within server-side demo.

